Author: Gabriel Bauer

  • Why Getting Your Query Preprocessing Technique Right makes Onsite Search better?

    Why Getting Your Query Preprocessing Technique Right makes Onsite Search better?

    Why Getting Your Query Preprocessing Technique Right makes Onsite Search better?

    Query preprocessing

    In this post, I present how query preprocessing can make your on-site search better in multiple ways and why this process should be a separate step in your search optimization. Below I will present the following points:

    • What is query preprocessing and why should you use it?
    • What is the problem with common structures?
    • What are the benefits of externalizing the query preprocessing step from your search engine?

    What is Query Preprocessing and Why You Should Use It

    Your onsite search is basically an Information Retrieval (IR) System. Its goal is to ensure your customer (the user) is able to get the relevant information from it. In the case of an ecommerce shop this is typically products he searched for or wants to buy. Of course, there are many goals for your website, like using marketing campaigns to increase revenue and so on. However, the main goal is to show your customers the products and information they searched for. The problem is that the user approaches a search in your shop in his or her own personal way. Each customer speaks his or her own vernacular if you will. Therefore, it simply isn’t feasible to force customers to, or imply they should speak the language of your particular onsite-search. Especially, considering the overwhelming likelihood that your search engine will require some kind of technical speak to reach peak performance.

    In my experience, there are two extreme examples of why queries do not return the desired search results aside from the shop not stocking the right product or missing information the customer is looking for.

    1. Not enough information in the query -> short queries like “computer”
    2. Too much noise in the query -> queries like “mobile computer I can take with me”

    In the first case, we expand the query from “computer” to something like: “computer OR PC OR laptop OR notebook OR mobile computer”, to get the best results for our users.

    In the second case, we first have to shrink the query by removing the noise from “mobile computer I can take with me” to “mobile computer”, before expanding to something like: “laptop OR notebook OR mobile computer” to get the best results for our users.

    Of course, these aren’t the only query preprocessing tasks. The following is an overview of typical tasks performed to close the gap between the user’s language and the search engine to return better results:

    • Thesaurus and Synonyms entries
    • Stemming – reducing words to their root parts
    • Lower Casing
    • Asciifying
    • Decomposition
    • Stop-Words handling – eliminating non-essential words like (the, it, and, a, etc.)
    • Localization
    • etc.

    The Problem with Common Information Retrieval Structures

    The preprocessing described above is normally carried out and configured within your search engine. The following graphic shows an overly simplified common onsite search structure:

    1. Users search using their own language and context regarding your products. This means that they will not intuitively understand the language most preferable to your Information Retrieval (IR) System.
    2. In a nutshell your onsite search is a highly configurable IR which currently performs all preprocessing.
    3. The raw data used by your IR for searching.

    In addition to optimizations like correctly configuring fields and their meanings, or running high-return marketing campaigns, most optimizations to your onsite search are done by query preprocessing.

    So here’s my question: does it really make sense to do all this pre-processing within a search engine?

    Have a look at this overview of potential obstacles when pre-processing is handled within the search engine:

    • A deep knowledge of your search engine and its configuration is necessary.
    • Changing to a new onsite search technology means losing or having to migrate all previous knowledge.
    • Onsite search is not inherently able to handle all your pre-processing needs.
    • Debugging errors within a search result is unwieldy, then it’s necessary to audit both pre-processors as well as related parts of the onsite search configuration.

    The Benefits of Extracting the Query Preprocessing Step from Your Onsite Search Engine

    Having illustrated what query preprocessing is, and which potential problems you could face when running this step inside your search engine, I want now to make a case for the benefits of externalizing this step in the optimization process. Have a look at the graphic below for a high-level illustration of the concept when preprocessing is done outside your search engine.

    • The effort it takes to configure your onsite search engine when migrating from one search vendor to another, can be dramatically decreased as a result of having externalized the query preprocessing. This also has the following benefits:
    • less time spent trying to understand complex search engine configurations.
    • Lower total cost of onsite search ownership
    • Your query preprocessing gains independence from your search engine’s main features.
    • Externalizing means you can cache the query preprocessing independently of your search engine which has a positive impact on related areas like total cost of ownership, the environment, and so on. Take a look at this article for more information.
    • Debugging search results is easier. The exact query string, used by the search engine, is always transparently visible.

    Now you know the benefits of query preprocessing and why it could make sense to externalize this step in your data pipeline optimizations.

  • Benchmark Open Commerce Search Stack with Rally

    Benchmark Open Commerce Search Stack with Rally

    Benchmark Open Commerce Search Stack
    with Rally

    In my last article, we learned how to create and run a Rally-Track. In this article, we’ll take a deeper and look at a real-world Rally example. I’ve chosen to use OCSS, where we can easily have more than 50.000 documents in our index and about 100.000 operations per day. So let’s begin by identifying which challenges make sense for our sample project.

    Identify what you want to test for your benchmarking

    Before benchmarking, it must be clear what we want to test. This is needed to prepare the Rally tracks and determine which data to use for the benchmark. In our case, we want to benchmark the user’s perspective on our stack. The open-commerce search stack, or OCSS, uses ElasticSearch for a commerce search engine. In this context, a user has two main tasks within ElasticSearch:

    • searching
    • indexing

    We can now divide these two operations into three cases. Below, you will find them listed in order of importance for the project at hand:

    1. searching
    2. searching while indexing
    3. indexing

    Searching

    In the context of OCSS, search performance has a direct impact on usability. As a result, search performance is the benchmark we focus on most in our stack. Furthermore, [OCSS] does more than transforming the user query into a simple ElasticSearch query. OCSS goes a step further and uses a single search query to generate one or more complex ElasticSearch queries (take a look here for more detailed explanation). For this reason, our test must account for this as well.

    Searching while Indexing

    Sometimes it’s necessary to simultaneously search and index your complete product data. The current [OCSS] search index is independent of the product data. This architecture was born out of Elasticsearch’s lack of native standard tools (not requiring hackarounds over snapshots) to clearly and permanently define nodes for indexing and nodes for searching. As a result, the indexing load influences the whole cluster performance. This must be benchmarked.

    Indexing

    The impact of indexing time to the user within OCSS is marginal. However, in the interest of a comprehensive understanding of the data, we will also test indexing times independently. And rounding off our index tests: we want to determine how long a complete product index could possibly take to run.

    What data should be used for testing and how to get it

    For our benchmark, we will need two sets of data. The index data itself, with the index settings and the search queries from OCSS to ElasticSearch. The index data and settings within Elasticsearch are easily extracted using the Rally create-track command. Enabling the spring-profile: trace-searches allows us to retrieve the Elasticsearch queries generated by the OCSS based on the user query. Then configure the logback function in OCSS so that each search records to the searches.log. This log contains both the raw user query and the generated Elasticsearch query from OCSS.

    How to create a track under normal circumstances

    After we have the data and basic track (generated by the create-track command) without challenges, it’s time to execute our challenges from above. However, because Rally has no operation to iterate and subsequently render every file line as a search, we would have to create a custom runner to provide this operation.

    Do it the OCSS way

    We will not do this by hand in our sample but rather enable the trace-searches profile and use the OCSS bash script to extract the index data and settings. This will generate a track based on the index and search data outlined in the cases above.

    So once we have OCSS up and running and enough time has passed to gather a representative number of searches, we can use the script to create a track using production data. For more information, please take a look here. The picture below is a good representation of what we’re looking at:

    Make sure you have all requirements installed before running the following commands.

    First off: identify the data index within OCSS:

    				
    					(/tmp/blog)➜  test_track$ curl http://localhost:9200/_cat/indices
    green open ocs-1-blog kjoOLxAmTuCQ93INorPfAA 1 1 52359 0 16.9mb 16.9mb


    Once you have the index and the searches.log you can run the following script:

    				
    					(open-commerce-stack)➜  esrally$ ./create-es-rally-track.sh -i ocs-1-blog -f ./../../../search-service/searches.log -o /tmp -v -s 127.0.0.1:9200
    Creating output dir /tmp ...
    Output dir /tmp created.
    Creating rally data from index ocs-1-blog ...
        ____        ____
       / __ ____ _/ / /_  __
      / /_/ / __ `/ / / / / /
     / _, _/ /_/ / / / /_/ /
    /_/ |_|__,_/_/_/__, /
                    /____/
    [INFO] Connected to Elasticsearch cluster [ocs-es-default-1] version [7.5.2].
    Extracting documents for index [ocs-1-blog]...       1001/1000 docs [100.1% done]
    Extracting documents for index [ocs-1-blog]...       2255/2255 docs [100.0% done]
    [INFO] Track ocss-track has been created. Run it with: esrally --track-path=/tracks/ocss-track
    --------------------------------
    [INFO] SUCCESS (took 25 seconds)
    --------------------------------
    Rally data from index ocs-1-blog in /tmp created.
    Manipulate generated /tmp/ocss-track/track.json ...
    Manipulated generated /tmp/ocss-track/track.json.
    Start with generating challenges...
    Challenges from search log created.


    If the script is finished, the folder ocss-track is created in the output location /tmp/. Let’s get an overview using tree:

    				
    					(/tmp/blog)➜  test_track$ tree /tmp/ocss-track 
    /tmp/ocss-track
    ├── challenges
    │   ├── index.json
    │   ├── search.json
    │   └── search-while-index.json
    ├── custom_runner
    │   └── ocss_search_runner.py
    ├── ocs-1-blog-documents-1k.json
    ├── ocs-1-blog-documents-1k.json.bz2
    ├── ocs-1-blog-documents.json
    ├── ocs-1-blog-documents.json.bz2
    ├── ocs-1-blog.json
    ├── rally.ini
    ├── searches.json
    ├── track.json
    └── track.py
    2 directories, 13 files


    OCSS output

    As you can see, we have 2 folders and 13 files. The challenges folder contains 3 files where each file contains one of our identified cases. The 3 files in the challenges folder are loaded in track.json.

    OCSS Outputs JSON Tracks

    The custom_runner folder contains the ocss_search_runner.py. This is where our custom operation is stored. It controls the iterations across searches.json. This same operation fires each Elasticseach query to be benchmarked against Elasticsearch. The custom runner must be registered in track.py. The ocs-1-blog.json contains the index settings. The files ocs-1-blog-documents-1k.json and ocs-1-blog-documents.json include the index documents; and are available as .bz2 files. The last file we have is the rally.ini file; it contains all Rally settings and, in the event a more detailed export is required, beyond a simple summary like in the example below, this file specifies where the metrics should be outputted. The following section of rally.inidefines that the result data should be stored in Elasticsearch:

    				
    					[reporting]
    datastore.type = elasticsearch
    datastore.host = 127.0.0.1
    datastore.port = 9400
    datastore.secure = false
    datastore.user = 
    datastore.password = 


    Overview of what we want to do:

    Run the benchmark challenges

    Now that the track is generated, it’s time to run the benchmark. But, first, we have to initiate Elasticsearch and Kibana for the benchmark results. This is what docker-compose-results.yaml is for. You can find here.

    				
    					(open-commerce-stack)➜  esrally$ docker-compose -f docker-compose-results.yaml up -d
    Starting esrally_kibana_1 ... done
    Starting elasticsearch    ... done
    (open-commerce-stack)➜  esrally$ docker ps
    CONTAINER ID        IMAGE                                                       COMMAND                  CREATED             STATUS              PORTS                              NAMES
    b3ebb8154df5        docker.elastic.co/elasticsearch/elasticsearch:7.9.2-amd64   "/tini -- /usr/local…"   15 seconds ago      Up 3 seconds        9300/tcp, 0.0.0.0:9400->9200/tcp   elasticsearch
    fc454089e792        docker.elastic.co/kibana/kibana:7.9.2                       "/usr/local/bin/dumb…"   15 seconds ago      Up 2 seconds        0.0.0.0:5601->5601/tcp             esrally_kibana_1


    Benchmark Challenge #1

    Once the Elasticsearch/Kibana stack is ready for the results, we can begin with our first benchmark challenge by sending indexthe following command:

    				
    					docker run -v "/tmp/ocss-track:/rally/track" -v "/tmp/ocss-track/rally.ini:/rally/.rally/rally.ini" --network host  
        elastic/rally race --distribution-version=7.9.2 --track-path=/rally/track --challenge=index --pipeline=benchmark-only --race-id=index


    Now would be a good time to have a look at the different parameters available to start Rally:

    • –distribution-version=7.9.2 -> The version of Elasticsearch Rally should use for benchmarking
    • –track-path=/rally/track -> The path where we mounted our track into the rally docker-container
    • –challenge=index -> The name of the challenge we want to perform
    • –pipeline=benchmark-only the pipeline rally should perform
    • –race-id=index -> The race-id which to use instead of a generated id (helpful for analyzing)

    Benchmark Challenge #2

    Following the index challenge we will continue with the search-while-index challenge:

    				
    					docker run -v "/tmp/ocss-track:/rally/track" -v "/tmp/ocss-track/rally.ini:/rally/.rally/rally.ini" --network host  
        elastic/rally race --distribution-version=7.9.2 --track-path=/rally/track --challenge=search-while-index --pipeline=benchmark-only --race-id=search-while-index


    Benchmark Challenge #3

    Last but not least the search challenge:

    				
    					docker run -v "/tmp/ocss-track:/rally/track" -v "/tmp/ocss-track/rally.ini:/rally/.rally/rally.ini" --network host  
        elastic/rally race --distribution-version=7.9.2 --track-path=/rally/track --challenge=search --pipeline=benchmark-only --race-id=search


    Review the benchmark results

    Let’s have a look at the benchmark results in Kibana. A few special dashboards exist for our use cases, but you’ll have to import them into Kibana. For example, have a look at either this one or this one here. Or, you can create your own visualization as I did:

    Search:

    In the above picture, we can see the search response times over time. Our searches take between 8ms and 27ms to be processed. Next, let’s go to the following picture. Here we see how search times are influenced by indexation.

    Search-while-index:

    The above image shows search response times over time while indexing. In the beginning, indexing while simultaneously searching increases the response time to 100ms. This later decreases to 10ms and 40ms.

    Summary

    This post gave you a more complete understanding of how benchmarking your site-search within Rally looks. Additionally, you learned about the unique OCSS application to trigger tracks within Rally. Not only that, you now have a better practical understanding of Rally benchmarking, which will help you create your own system even without OCSS.

    Thanks for reading!

    References

    https://github.com/elastic/rally

    https://esrally.readthedocs.io/en/stable/

    https://github.com/Abmun/rally-apm-search/blob/master/Rally-Results-Dashboard.ndjson

    https://github.com/elastic/rally/files/4479568/dashboard.ndjson.txt

  • How-To Setup Elasticsearch Benchmarking with Rally

    How-To Setup Elasticsearch Benchmarking with Rally

    How to set up Elasticsearch benchmarking, using Elastic’s own tools, is a necessity in today’s eCommerce. In my previous articles, I describe how to operate Elasticsearch in Kubernetes and how to monitor Elasticsearch. It’s time now to look at how Elastic’s homegrown benchmarking tool, Rally, will increase your performance, while saving you unnecessary cost, and headaches.

    This article is part one of a series. This first part provides you with:

    • a short overview of Rally
    • a short sample track

    Why to Benchmark in Elasticsearch with Rally?

    Surely, you’re thinking, why should I benchmark Elasticsearch, isn’t there a guide illustrating the best cluster specs for Elasticsearch, eliminating all my problems?

    The answer: a resounding “no”. There is no guide to tell you how the “perfect” cluster should look.

    After all, the “perfect” cluster highly depends on your data structure, your amount of data, and your operations against Elasticsearch. As a result, you will need to perform benchmarks relevant to your unique data and processes to find bottlenecks and tune your Elasticsearch cluster.

    What does Elastic’s Benchmarking Tool Rally Do?

    Rally is the macro-benchmarking framework for Elasticsearch from elastic itself. Developed for Unix, Rally runs best on Linux and macOS but also supports Elasticsearch clusters running Windows. Rally can help you with the following tasks:

    • Setup and teardown of an Elasticsearch cluster for benchmarking
    • Management of benchmark data and specifications even across Elasticsearch versions
    • Running benchmarks and recording results
    • Finding performance problems by attaching so-called telemetry devices
    • Comparing performance results and export them (e.g., to Elasticsearch itself)


    Because we are talking about benchmarking a cluster, Rally also needs to fit the requirements to benchmark clusters. For this reason, Rally has special mechanisms based on the Actor-Model to coordinate multiple Rally instances, like a “cluster” to benchmark a cluster.

    Basics about Rally Benchmarking

    Configure Rally using the rally.ini file. Take a look here to get an overview of the configuration options.

    Within Rally, benchmarks are defined in tracks. A track contains one or multiple challenges and all data needed for performing the benchmark.

    Data is organized in indices and corporas. The indices include the index name and index settings against which the benchmark must perform. Additionally, the indices include the corpora, which contains the data to be indexed.

    And, sticking with the “Rally” theme, if we run a benchmark, we call it a race.

    Every challenge has one or multiple operations applied in a sequence or parallel to the Elasticsearch.

    An operation, for example, could be a simple search or a create-index. It’s also possible to write simple or more complex operations called custom runners. However, there are pre-defined operations for the most common tasks. My illustration below will give you a simple overview of the architecture of a track:

    Note: the above image supplies a sample of the elements within a track to explain how the internal process looks.

    Simple sample track

    Below, an example of a track.json and an index-with-one-document.json for the index used in the corpora:

    				
    					{
      "version": 2,
      "description": "Really simple track",
      "indices": [
        {
          "name": "index-with-one-document"
        }
      ],
      "corpora": [
        {
          "name": "index-with-one-document",
          "documents": [
            {
              "target-index": "index-with-one-document",
              "source-file": "index-with-one-document.json",
              "document-count": 1
            }
          ]
        }
      ],
      "challenges": [
        {
          "name": "index-than-search",
          "description": "first index one document, then search for it.",
          "schedule": [
            {
              "operation": {
                "name": "clean elasticsearch",
                "operation-type": "delete-index"
              }
            },
            {
              "name": "create index index-with-one-document",
              "operation": {
                "operation-type": "create-index",
                "index": "index-with-one-document"
              }
            },
            {
              "name": "bulk index documents into index-with-one-document",
              "operation": {
                "operation-type": "bulk",
                "corpora": "index-with-one-document",
                "indices": [
                  "index-with-one-document"
                ],
                "bulk-size": 1,
                "clients": 1
              }
            },
            {
              "operation": {
                "name": "perform simple search",
                "operation-type": "search",
                "index": "index-with-one-document"
              }
            }
          ]
        }
      ]
    }


    index-with-one-document.json:

    				
    					{ "name": "Simple test document." }


    The track above contains one challenge, one index, and one corpora. The corpora refers to the index-with-one-document.json, which includes one document for the index. The challenge has four operations:

    delete-index → delete the index from Elasticsearch so that we have a clean environment create-index → create the index we may have deleted before Bulk → bulk index our sample document from index-with-one-document.json. Search → perform a single search against our index

    Taking Rally for a Spin

    Let’s race this simple track and see what we get:

    				
    					(⎈ |qa:/tmp/blog)➜  test_track$ esrally --distribution-version=7.9.2 --track-path=/tmp/blog/test_track     
        ____        ____
       / __ ____ _/ / /_  __
      / /_/ / __ `/ / / / / /
     / _, _/ /_/ / / / /_/ /
    /_/ |_|__,_/_/_/__, /
                    /____/
    [INFO] Preparing for race ...
    [INFO] Preparing file offset table for [/tmp/blog/test_track/index-with-one-document.json] ... [OK]
    [INFO] Racing on track [test_track], challenge [index and search] and car ['defaults'] with version [7.9.2].
    Running clean elasticsearch                                                    [100% done]
    Running create index index-with-one-document                                   [100% done]
    Running bulk index documents into index-with-one-document                      [100% done]
    Running perform simple search                                                  [100% done]
    ------------------------------------------------------
        _______             __   _____
       / ____(_)___  ____ _/ /  / ___/_________  ________
      / /_  / / __ / __ `/ /   __ / ___/ __ / ___/ _ 
     / __/ / / / / / /_/ / /   ___/ / /__/ /_/ / /  /  __/
    /_/   /_/_/ /_/__,_/_/   /____/___/____/_/   ___/
    ------------------------------------------------------
    |                                                         Metric |                                              Task |       Value |   Unit |
    |---------------------------------------------------------------:|--------------------------------------------------:|------------:|-------:|
    |                     Cumulative indexing time of primary shards |                                                   | 8.33333e-05 |    min |
    |             Min cumulative indexing time across primary shards |                                                   | 8.33333e-05 |    min |
    |          Median cumulative indexing time across primary shards |                                                   | 8.33333e-05 |    min |
    |             Max cumulative indexing time across primary shards |                                                   | 8.33333e-05 |    min |
    |            Cumulative indexing throttle time of primary shards |                                                   |           0 |    min |
    |    Min cumulative indexing throttle time across primary shards |                                                   |           0 |    min |
    | Median cumulative indexing throttle time across primary shards |                                                   |           0 |    min |
    |    Max cumulative indexing throttle time across primary shards |                                                   |           0 |    min |
    |                        Cumulative merge time of primary shards |                                                   |           0 |    min |
    |                       Cumulative merge count of primary shards |                                                   |           0 |        |
    |                Min cumulative merge time across primary shards |                                                   |           0 |    min |
    |             Median cumulative merge time across primary shards |                                                   |           0 |    min |
    |                Max cumulative merge time across primary shards |                                                   |           0 |    min |
    |               Cumulative merge throttle time of primary shards |                                                   |           0 |    min |
    |       Min cumulative merge throttle time across primary shards |                                                   |           0 |    min |
    |    Median cumulative merge throttle time across primary shards |                                                   |           0 |    min |
    |       Max cumulative merge throttle time across primary shards |                                                   |           0 |    min |
    |                      Cumulative refresh time of primary shards |                                                   | 0.000533333 |    min |
    |                     Cumulative refresh count of primary shards |                                                   |           3 |        |
    |              Min cumulative refresh time across primary shards |                                                   | 0.000533333 |    min |
    |           Median cumulative refresh time across primary shards |                                                   | 0.000533333 |    min |
    |              Max cumulative refresh time across primary shards |                                                   | 0.000533333 |    min |
    |                        Cumulative flush time of primary shards |                                                   |           0 |    min |
    |                       Cumulative flush count of primary shards |                                                   |           0 |        |
    |                Min cumulative flush time across primary shards |                                                   |           0 |    min |
    |             Median cumulative flush time across primary shards |                                                   |           0 |    min |
    |                Max cumulative flush time across primary shards |                                                   |           0 |    min |
    |                                             Total Young Gen GC |                                                   |       0.022 |      s |
    |                                               Total Old Gen GC |                                                   |       0.033 |      s |
    |                                                     Store size |                                                   | 3.46638e-06 |     GB |
    |                                                  Translog size |                                                   | 1.49012e-07 |     GB |
    |                                         Heap used for segments |                                                   |  0.00134659 |     MB |
    |                                       Heap used for doc values |                                                   | 7.24792e-05 |     MB |
    |                                            Heap used for terms |                                                   | 0.000747681 |     MB |
    |                                            Heap used for norms |                                                   | 6.10352e-05 |     MB |
    |                                           Heap used for points |                                                   |           0 |     MB |
    |                                    Heap used for stored fields |                                                   | 0.000465393 |     MB |
    |                                                  Segment count |                                                   |           1 |        |
    |                                                 Min Throughput | bulk index documents into index-with-one-document |         7.8 | docs/s |
    |                                              Median Throughput | bulk index documents into index-with-one-document |         7.8 | docs/s |
    |                                                 Max Throughput | bulk index documents into index-with-one-document |         7.8 | docs/s |
    |                                       100th percentile latency | bulk index documents into index-with-one-document |     123.023 |     ms |
    |                                  100th percentile service time | bulk index documents into index-with-one-document |     123.023 |     ms |
    |                                                     error rate | bulk index documents into index-with-one-document |           0 |      % |
    |                                                 Min Throughput |                             perform simple search |       16.09 |  ops/s |
    |                                              Median Throughput |                             perform simple search |       16.09 |  ops/s |
    |                                                 Max Throughput |                             perform simple search |       16.09 |  ops/s |
    |                                       100th percentile latency |                             perform simple search |     62.0082 |     ms |
    |                                  100th percentile service time |                             perform simple search |     62.0082 |     ms |
    |                                                     error rate |                             perform simple search |           0 |      % |
    --------------------------------
    [INFO] SUCCESS (took 39 seconds)
    --------------------------------


    Parameters we used:

    • distribution-version=7.9.2 → The version of Elasticsearch Rally should start/use for benchmarking.
    • track-path=/tmp/blog/test_track → The path to our track location.

    As you can see, Rally provides us a summary of the benchmark and information about each operation and how they performed.

    Rally Benchmarking in the Wild

    This part-one introduction to Rally Benchmarking hopefully piqued your interest for what’s to come. My next post will dive deeper into a more complex sample. I’ll use a real-world benchmarking scenario within OCSS (Open Commerce Search Stack) to illustrate how to export benchmark-metrics to Elasticsearch, which can then be used in Kibana for analysis.

    References

  • Monitor Elasticsearch in Kubernetes Using Prometheus

    Monitor Elasticsearch in Kubernetes Using Prometheus

    In this article, I will show how to monitor Elasticsearch running inside Kubernetes using the Prometheus-operator, and later Grafana for visualization. Our sample will be based on the cluster described in my last article.

    There are plenty of businesses that have to run and operate Elasticsearch on their own. This can be solved pretty well, because of the wide range of deployment types and the large community (an overview here). However, if you’re serious about running Elasticsearch, perhaps as a critical part of your application, you MUST monitor. In this article, I will show how to monitor Elasticsearch running inside Kubernetes using Prometheus as monitoring software. We will use the Prometheus-operator for Kubernetes, but it will work with a plain Prometheus in the same way.

    Overview of Elasticsearch Monitoring using Prometheus

    If we talk about monitoring Elasticsearch, we have to keep in mind, that there are multiple layers to monitor:

    It is worth noting that every one of these methods uses the Elasticsearch internal stats gathering logic to collect data about the underlying JVM and Elasticsearch itself.

    The Motivation Behind Monitoring Elasticsearch Independently

    Elasticsearch already contains monitoring functionality, so why try to monitor Elasticsearch with an external monitoring system? Some reasons to consider:

    • If Elasticsearch is broken, the internal monitoring is broken
    • You already have a functioning monitoring system with processes for alerting, user management, etc.

    In our case, this second point was the impetus for using Prometheus to monitor Elasticsearch.

    Let’s Get Started – Install the Plugin

    To monitor Elasticsearch with Prometheus, we have to export the monitoring data in the Prometheus exposition format. To this end, we have to install a plugin in our Elasticsearch cluster which exposes the information in the right format under /_prometheus/metrics. If we are using the Elasticsearch operator, we can install the plugin in the same way as the S3 plugin, from the last post, using the init container:

    				
    					version: 7.7.0
     ...
     nodeSets:
     - name: master-zone-a
       ...
       podTemplate:
         spec:
           initContainers:
           - name: sysctl
             securityContext:
               privileged: true
             command: ['sh', '-c', 'sysctl -w vm.max_map_count=262144']
           - name: install-plugins
             command:
             - sh
             - -c
             - |
               bin/elasticsearch-plugin install -b repository-s3 https://github.com/vvanholl/elasticsearch-prometheus-exporter/releases/download/7.7.0.0/prometheus-exporter-7.7.0.0.zip
       ...


    If you are not using the Elasticsearch-operator, you have to follow the Elasticsearch plugin installation instructions.

    Please note: there is more than one plugin on the market for exposing elasticsearch monitoring data in the Prometheus format, but the Elasticsearch-prometheus-exporter we are using is one of the larger projects which is active and has a big community.

    If you are using elasticsearch > 7.17.7 (including 8.x), take a look at the following plugin instead: https://github.com/mindw/elasticsearch-prometheus-exporter/

    After installing the plugin, we should now be able to fetch monitoring data from the /_prometheus/metrics endpoint. To test the plugin, we can use Kibana to perform a request against the endpoint. See the picture below:

    How To Configure Prometheus

    At this point, it’s time to connect Elasticsearch to Prometheus. Now, we can create a ServiceMonitor because we are using the Prometheus-operator for monitoring internal Kubernetes applications. See an example below, which can be used to monitor the Elasticsearch cluster we created in my last post:

    				
    					apiVersion: monitoring.coreos.com/v1
    kind: ServiceMonitor
    metadata:
     labels:
       app: prometheus
       prometheus: kube-prometheus
       chart: prometheus-operator-8.13.8
       release: prometheus-operator
     name: blogpost-es
     namespace: monitoring
    spec:
     endpoints:
       - interval: 30s
         path: "/_prometheus/metrics"
         port: https
         scheme: https
         tlsConfig:
           insecureSkipVerify: true
         basicAuth:
           password:
             name: basic-auth-es
             key: password
           username:
             name: basic-auth-es
             key: user
     namespaceSelector:
       matchNames:
       - blog
     selector:
       matchLabels:
         common.k8s.elastic.co/type: elasticsearch
         elasticsearch.k8s.elastic.co/cluster-name: blogpost


    For those unfamiliar with the Prometheus-operator or are using plain Prometheus to monitor Elasticsearch. The ServiceMonitor will create a Prometheus job like the one below:

    				
    					- job_name: monitoring/blogpost-es/0
      honor_timestamps: true
      scrape_interval: 30s
      scrape_timeout: 10s
      metrics_path: /_prometheus/metrics
      scheme: https
      kubernetes_sd_configs:
      - role: endpoints
        namespaces:
          names:
          - blog
      basic_auth:
        username: elastic
        password: io3Ahnae2ieW8Ei3aeZahshi
      tls_config:
        insecure_skip_verify: true
      relabel_configs:
      - source_labels: [__meta_kubernetes_service_label_common_k8s_elastic_co_type]
        separator: ;
        regex: elasticsearch
        replacement: $1
        action: keep
      - source_labels: [__meta_kubernetes_service_label_elasticsearch_k8s_elastic_co_cluster_name]
        separator: ;
        regex: ui
        replacement: $1
        action: keep
      - source_labels: [__meta_kubernetes_endpoint_port_name]
        separator: ;
        regex: https
        replacement: $1
        action: keep
      - source_labels: [__meta_kubernetes_endpoint_address_target_kind, __meta_kubernetes_endpoint_address_target_name]
        separator: ;
        regex: Node;(.*)
        target_label: node
        replacement: ${1}
        action: replace
      - source_labels: [__meta_kubernetes_endpoint_address_target_kind, __meta_kubernetes_endpoint_address_target_name]
        separator: ;
        regex: Pod;(.*)
        target_label: pod
        replacement: ${1}
        action: replace
      - source_labels: [__meta_kubernetes_namespace]
        separator: ;
        regex: (.*)
        target_label: namespace
        replacement: $1
        action: replace
      - source_labels: [__meta_kubernetes_service_name]
        separator: ;
        regex: (.*)
        target_label: service
        replacement: $1
        action: replace
      - source_labels: [__meta_kubernetes_pod_name]
        separator: ;
        regex: (.*)
        target_label: pod
        replacement: $1
        action: replace
      - source_labels: [__meta_kubernetes_service_name]
        separator: ;
        regex: (.*)
        target_label: job
        replacement: ${1}
        action: replace
      - separator: ;
        regex: (.*)
        target_label: endpoint
        replacement: https
        action: replace


    Warning!: in our example, the scrap interval is 30 seconds. It may be necessary to adjust the interval for your production cluster. Proceed with caution! Gathering information for every scrape creates a heavy load on your Elasticsearch cluster, especially on the master nodes. A short scrape interval can easily kill your cluster.

    If your configuration of Prometheus was successful, you will now see the cluster under the “Targets” section of Prometheus under “All”. See the picture below:

    Import Grafana-Dashboard

    Theoretically, we are now finished. However, because most people out there use Prometheus with Grafana, I want to show how to import the dashboard especially made for this plugin. You can find it here on grafana.com. The screenshots below explain how to import the Dashboard:


    Following the dashboard import, you should see the elasticsearch monitoring graphs as in the following screenshot:

    Wrapping Up

    In this article, we briefly covered the possible monitoring options. I showed why it makes sense to monitor elasticsearch using an external monitoring system and some reasons for doing so. Finally, I showed how to monitor Elasticsearch with Prometheus and Grafana for visualization.

  • How to Deploy Elasticsearch in Kubernetes Using the cloud-on-k8s Elasticsearch-Operator

    How to Deploy Elasticsearch in Kubernetes Using the cloud-on-k8s Elasticsearch-Operator

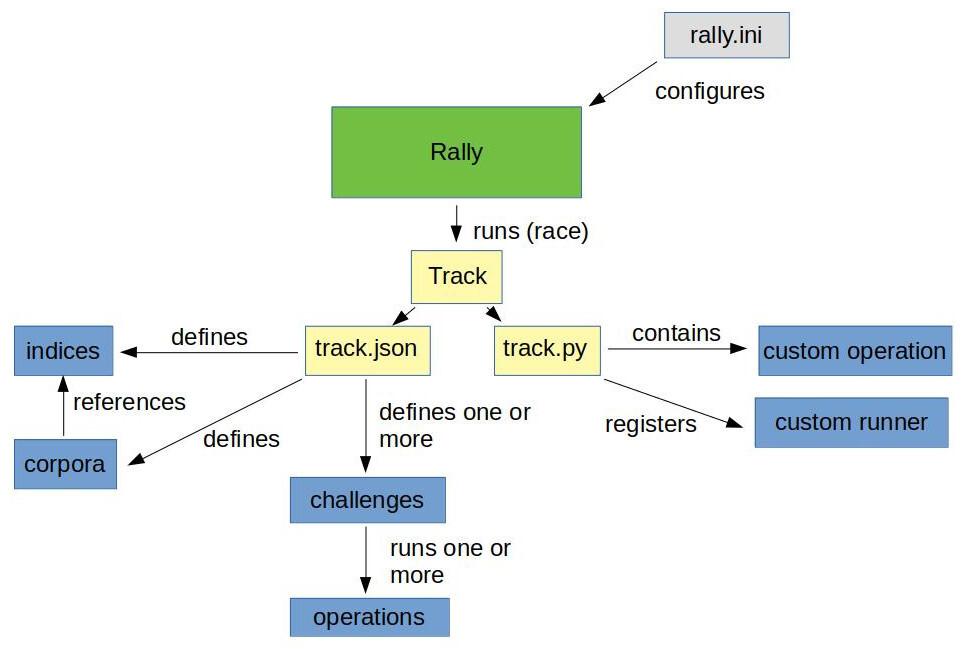
    Many businesses run an Elasticsearch/Kibana stack. Some use a SaaS-Service for Elastic — i.e., the AWS Amazon Elasticsearch Service; the Elastic in Azure Service from Microsoft; or the Elastic Cloud from Elastic itself. More commonly, Elasticsearch is hosted in a proprietary environment. Elastic and the community provide several deployment types and tips for various platforms and frameworks. In this article, I will show how to deploy Elasticsearch and Kibana in a Kubernetes Cluster using the Elastic Kubernetes Operator (cloud-on-k8s) without using Helm (helm / helm-charts). Overview of Elastic Deployment Types and Configuration:

    The Motivation for Using the Elasticsearch-Operator:

    What might be the motivation for using the Elasticsearch-Operator instead of using any other SaaS-Service?

    The first argument is, possibly, the cost. The Elastic Cloud is round about 34% pricier than hosting your own Elasticsearch on the same instance in AWS. Furthermore, the AWS Amazon Elasticsearch Service is even 50% more expensive than the self-hosted version.

    Another argument could be that you already have a Kubernernetes-Cluster running with the application which you would like to use Elasticsearch with. For this reason, you want to avoid spreading one application over multiple environments. So, you are looking to use Kubernetes as your go-to standard.

    Occasionally, you may also have to build a special solution with many customizations that are not readily deployable with a SaaS provider.

    An important argument for us was the hands-on experience hosting Elasticsearch, to give the best support to our customers.

    Cluster Target Definition:

    For the purposes of this post, I will use a sample cluster running on AWS. Remember to always include the following features:

    • 6 node clusters (3 es-master, 3 es-data)
    • master and data nodes are spread over 3 availability zones
    • a plugin installed to snapshot data on S3
    • dedicated nodes where only elastic services are running on
    • affinities that not two elastic nodes from the same type are running on the same machine


    Due to this article’s focus on how to use the Kubernetes Operator, we will not provide any details regarding necessary instances, the reason for creating different instance groups, or the reasons behind several pod anti affinities.

    In our Kubernetes cluster, we have two additional Instance Groups for Elasticsearch: es-master and es-data where the nodes have special taints.

    (In our example case, the instance groups are managed by kops. However, you can simply add the labels and taints to each node manually.)

    The Following is an example of how a node of the es-master instance group looks like:

    				
    					apiVersion: v1
    kind: Node
    metadata:
      ...
      labels:
        failure-domain.beta.kubernetes.io/zone: eu-north-1a
        kops.k8s.io/instancegroup: es-master
        kubernetes.io/hostname: ip-host.region.compute.internal
        ...
    spec:
      ...
      taints:
      - effect: NoSchedule
        key: es-node
        value: master


    As you may have noticed, there are three different labels:

    1. The failure-domain.beta.kubernetes.io/zone contains the information pertaining to the availability zone in which the instance is running.
    2. The kops.k8s.io/instancegroup contains the information in which instance the group resides. This will be important later to allow both master and data nodes to run on different hardware for performance optimization.
    3. The kubernetes.io/hostname acts as a constraint to ensure only one master node is running the specified instance.


    Following is an example of an es-data instance with the appropriate label keys, and respective values:

    				
    					apiVersion: v1
    kind: Node
    metadata:
      ...
      labels:
        failure-domain.beta.kubernetes.io/zone: eu-north-1a
        kops.k8s.io/instancegroup: es-data
        kubernetes.io/hostname: ip-host.region.compute.internal
        ...
    spec:
      ...
      taints:
      - effect: NoSchedule
        key: es-node
        value: data


    As you can see, the value of the es-node taint and the kops.k8s.io/instancegroup label differs. We will reference these values later to decide between data and master instances.

    Now that we have illustrated our node structure, and you are better able to grasp our understanding of the Kubernetes and Elasticsearch cluster, we can begin installation of the Elasticsearch operator in Kubernetes.

    Let’s Get Started:

    First: install the Kubernetes Custom Resource Definitions, RBAC rules (if RBAC is activated in the cluster in question), and a StatefulSet for the elastic-operator pod. In our example case, we have RBAC activated and can make use of the all-in-one deployment file from Elastic for installation.

    (Notice: If RBAC is not activated in your cluster, then remove line 2555 – 2791 and all service-account references in the file):

    				
    					kubectl apply -f https://download.elastic.co/downloads/eck/1.2.1/all-in-one.yaml


    This creates four main parts in our Kubernetes cluster to operate Elasticsearch:

    • All necessary Custom Resource Definitions
    • All RBAC Permissions which are needed
    • A Namespace for the Operator (elastic-system)
    • A StatefulSet for the Elastic Operator-Pod

    Now perform kubectl logs -f on the operator’s pod and wait until the operator has successfully booted to verify the Installation. Respond to any errors, should an error message appear.

    				
    					kubectl -n elastic-system logs -f statefulset.apps/elastic-operator


    Once confirmed that the operator is up and running we can begin with our Elasticsearch cluster. We begin by creating an Elasticsearch resource with the following main structure (see here for full details):

    				
    					apiVersion: elasticsearch.k8s.elastic.co/v1
    kind: Elasticsearch
    metadata:
      name: blogpost # name of the elasticsearch cluster
      namespace: blog
    spec:
      version: 7.7.0 # elasticsearch version to deploy
      nodeSets: # nodes of the cluster
      - name: master-zone-a
        count: 1 # count how many nodes should be deployed
        config: # specific configuration for this node type
          node.master: true
        ...
      - name: master-zone-b
      - name: master-zone-c
      - name: data-zone-a
      - name: data-zone-b
      - name: data-zone-c


    In the listing above, you see how easily the name of the Elasticsearch cluster, as well as, the Elasticsearch version and different nodes that make up the cluster can be set. Our Elasticsearch structure is clearly specified in the array nodeSets, which we defined earlier. As a next step, we want to take a more in-depth look into a single nodeSet entry and see how this must look to adhere to our requirements:

    				
    					- name: master-zone-a
        count: 1
        config:
          node.master: true
          node.data: false
          node.ingest: false
          node.attr.zone: eu-north-1a
          cluster.routing.allocation.awareness.attributes: zone
        podTemplate:
          metadata:
            labels:
              component: elasticsearch
              role: es-master
          spec:
            volumes:
              - name: elasticsearch-data
                emptyDir: {}
            affinity:
              nodeAffinity:
                requiredDuringSchedulingIgnoredDuringExecution:
                  nodeSelectorTerms: 
                  - matchExpressions: # Kniff mit Liste
                    - key: kops.k8s.io/instancegroup
                      operator: In
                      values:
                      - es-master
                    - key: failure-domain.beta.kubernetes.io/zone
                      operator: In
                      values:
                      - eu-north-1a
              podAntiAffinity:
                preferredDuringSchedulingIgnoredDuringExecution:
                - weight: 100
                  podAffinityTerm:
                    labelSelector:
                      matchExpressions:
                      - key: role
                        operator: In
                        values:
                        - es-master
                    topologyKey: kubernetes.io/hostname
            initContainers:
            - name: sysctl
              securityContext:
                privileged: true
              command: ['sh', '-c', 'sysctl -w vm.max_map_count=262144']
            - name: install-plugins
              command:
              - sh
              - -c
              - |
                bin/elasticsearch-plugin install -b repository-s3
            tolerations:
            - key: "es-node"
              operator: "Equal"
              value: "master"
              effect: "NoSchedule"
            containers:
            - name: elasticsearch
              resources:
                requests:
                  memory: 1024Mi
                limits:
                  memory: 1024Mi


    The count key specifies, for example, how many pods Elasticsearch nodes should create with this node configuration for the cluster. The config object represents the untyped YAML configuration of Elasticsearch (Elasticsearch settings). The podTemplate contains a normal Kubernetes Pod template definition. Notice that here we are controlling the affinity and tolerations of our es-node to a special instance group and all pod affinities. In the initContainers section, we are handling kernel configurations and also the Elasticsearch repository-s3 plugin installation. One note on the nodeSelectorTerms: if you want to use the logical and condition instead of, or, you must place the conditions in a single matchExpressions array and not as two individual matchExpressions. For me, this was not clearly described in the Kubernetes documentation.

    Once we have created our Elasticsearch deployment, we must create a Kibana deployment. This can be done with the Kibana resource. The following is a sample of this definition:

    				
    					apiVersion: kibana.k8s.elastic.co/v1
    kind: Kibana
    metadata:
      name: blogpost
      namespace: blog
    spec:
      version: 7.7.0
      count: 1
      elasticsearchRef:
        name: blogpost
      podTemplate:
        metadata:
          labels:
            component: kibana


    Notice that the elasticsearchRef object must refer to our Elasticsearch to be connected with it.

    After we have created all necessary deployment files, we can begin deploying them. In our case, I put them in one big file called elasticseach-blog-example.yaml, you can find a complete list of the deployment files at the end of this blogpost.

    				
    					kubectl apply -f elasticsearch-blog-example.yaml


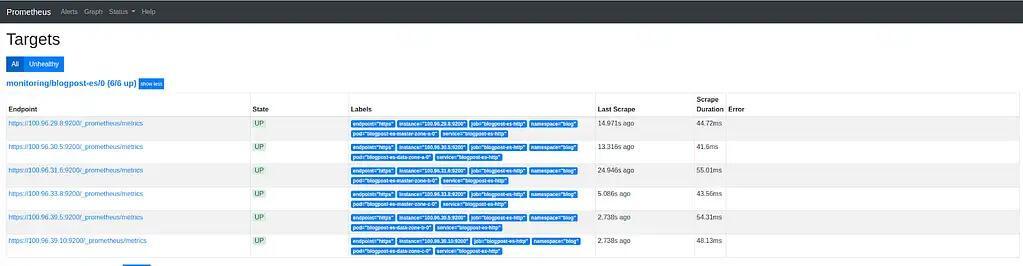
    After deploying the deployment file you should have a new namespace with the following pods, services and secrets (Of course with more resources, however this is not relevant for our initial overview):

    				
    					(⎈ |blog.k8s.local:blog)➜  ~ kubectl get pods,services,secrets 
    NAME                              READY  STATUS   RESTARTS  AGE
    pod/blogpost-es-data-zone-a-0     1/1    Running  0         2m
    pod/blogpost-es-data-zone-b-0     1/1    Running  0         2m
    pod/blogpost-es-data-zone-c-0     1/1    Running  0         2m
    pod/blogpost-es-master-zone-a-0   1/1    Running  0         2m
    pod/blogpost-es-master-zone-b-0   1/1    Running  0         2m
    pod/blogpost-es-master-zone-c-0   1/1    Running  0         2m
    pod/blogpost-kb-66d5cb8b65-j4vl4  1/1    Running  0         2m
    NAME                               TYPE       CLUSTER-IP     PORT(S)   AGE
    service/blogpost-es-data-zone-a    ClusterIP  None           <none>    2m
    service/blogpost-es-data-zone-b    ClusterIP  None           <none>    2m
    service/blogpost-es-data-zone-c    ClusterIP  None           <none>    2m
    service/blogpost-es-http           ClusterIP  100.68.76.86   9200/TCP  2m
    service/blogpost-es-master-zone-a  ClusterIP  None           <none>    2m
    service/blogpost-es-master-zone-b  ClusterIP  None           <none>    2m
    service/blogpost-es-master-zone-c  ClusterIP  None           <none>    2m
    service/blogpost-es-transport      ClusterIP  None           9300/TCP  2m
    service/blogpost-kb-http           ClusterIP  100.67.39.183  5601/TCP  2m
    NAME                                        DATA  AGE
    secret/default-token-thnvr                  3     2m
    secret/blogpost-es-data-zone-a-es-config    1     2m
    secret/blogpost-es-data-zone-b-es-config    1     2m
    secret/blogpost-es-elastic-user             1     2m
    secret/blogpost-es-http-ca-internal         2     2m
    secret/blogpost-es-http-certs-internal      3     2m
    secret/blogpost-es-http-certs-public        2     2m
    secret/blogpost-es-internal-users           2     2m
    secret/blogpost-es-master-zone-a-es-config  1     2m
    secret/blogpost-es-master-zone-b-es-config  1     2m
    secret/blogpost-es-master-zone-c-es-config  1     2m
    secret/blogpost-es-remote-ca                1     2m
    secret/blogpost-es-transport-ca-internal    2     2m
    secret/blogpost-es-transport-certificates   11    2m
    secret/blogpost-es-transport-certs-public   1     2m
    secret/blogpost-es-xpack-file-realm         3     2m
    secret/blogpost-kb-config                   2     2m
    secret/blogpost-kb-es-ca                    2     2m
    secret/blogpost-kb-http-ca-internal         2     2m
    secret/blogpost-kb-http-certs-internal      3     2m
    secret/blogpost-kb-http-certs-public        2     2m
    secret/blogpost-kibana-user                 1     2mm


    As you may have noticed, I removed the column EXTERNAL from the services and the column TYPE from the secrets. I did this due to the formatting in the code block.

    Once Elasticsearch and Kibana have been deployed we must test the setup by making an HTTP get request with the Kibana-Dev-Tools. First, we have to get the elastic user and password which the elasticsearch-operator generated for us. It’s saved in the Kubernetes Secret -es-elastic-user in our case blogpost-es-elastic-user.

    				
    					(⎈ |blog.k8s.local:blog)➜  ~ kubectl get secret/blogpost-es-elastic-user -o yaml 
    apiVersion: v1
    data:
      elastic: aW8zQWhuYWUyaWVXOEVpM2FlWmFoc2hp
    kind: Secret
    metadata:
      creationTimestamp: "2020-10-21T08:36:35Z"
      labels:
        common.k8s.elastic.co/type: elasticsearch
        eck.k8s.elastic.co/credentials: "true"
        elasticsearch.k8s.elastic.co/cluster-name: blogpost
      name: blogpost-es-elastic-user
      namespace: blog
      ownerReferences:
      - apiVersion: elasticsearch.k8s.elastic.co/v1
        blockOwnerDeletion: true
        controller: true
        kind: Elasticsearch
        name: blogpost
        uid: 7f236c45-a63e-11ea-818d-0e482d3cc584
      resourceVersion: "701864"
      selfLink: /api/v1/namespaces/blog/secrets/blogpost-es-elastic-user
      uid: 802ba8e6-a63e-11ea-818d-0e482d3cc584
    type: Opaque


    The user of our cluster is the key, located under data. In our case, elastic. The password is the corresponding value of this key. It’s Base64 encoded, so we have to decode it:

    				
    					(⎈ |blog.k8s.local:blog)➜  ~ echo -n "aW8zQWhuYWUyaWVXOEVpM2FlWmFoc2hp" | base64 -d
    io3Ahnae2ieW8Ei3aeZahshi


    Once we have the password we can port-forward the blogpost-kb-http service on port 5601 (Standard Kibana Port) to our localhost and access it with our web-browser at https://localhost:5601:

    				
    					(⎈ |blog.k8s.local:blog)➜  ~ kubectl port-forward service/blogpost-kb-http 5601      
    Forwarding from 127.0.0.1:5601 -> 5601
    Forwarding from [::1]:5601 -> 5601


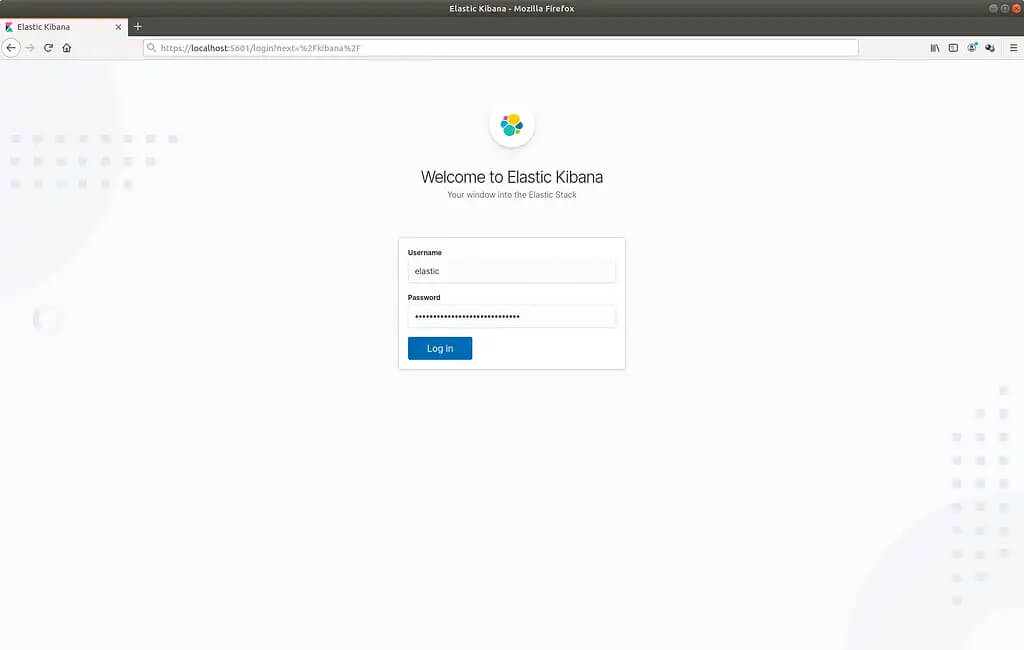
    Elasticsearch Kibana Login Screen

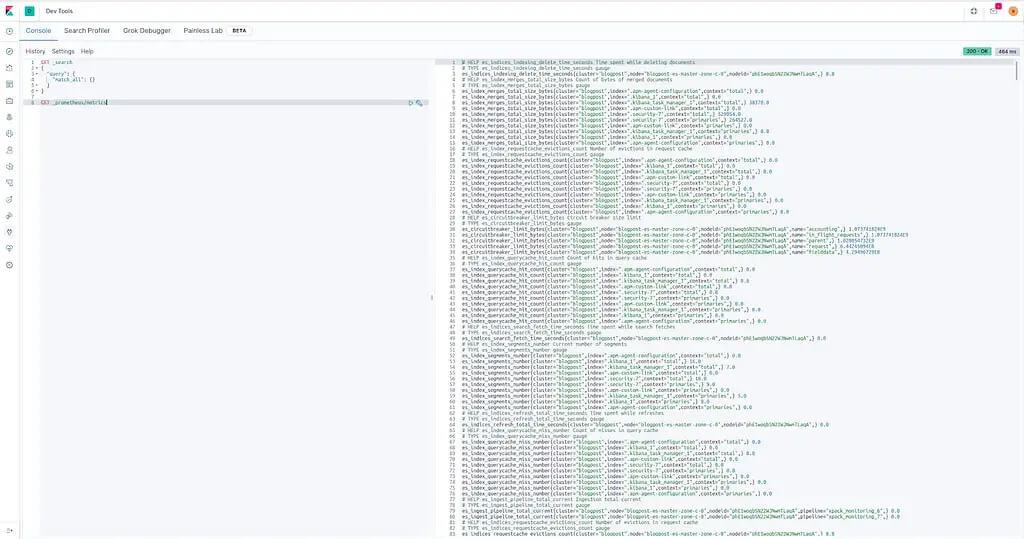
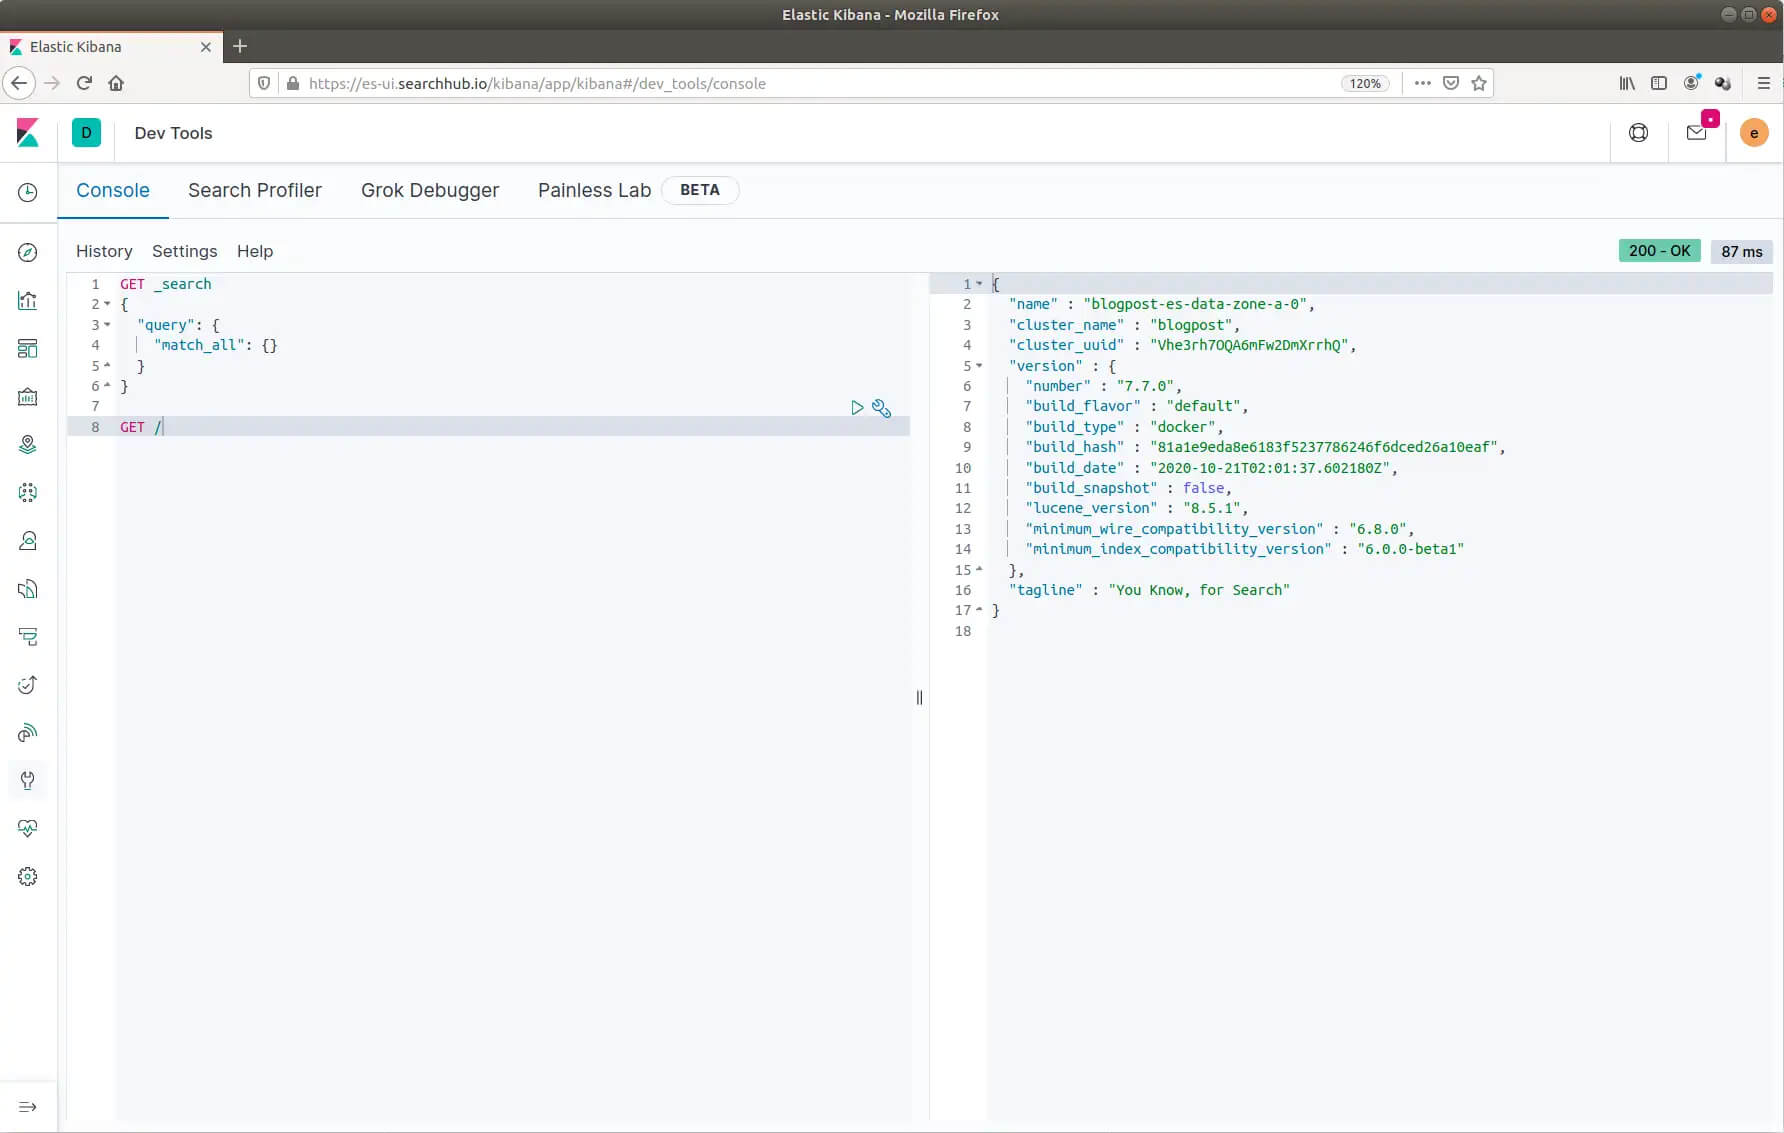
    After logging in, navigate on the left side to the Kibana Dev Tools. Now perform a GET / request, like in the picture below:

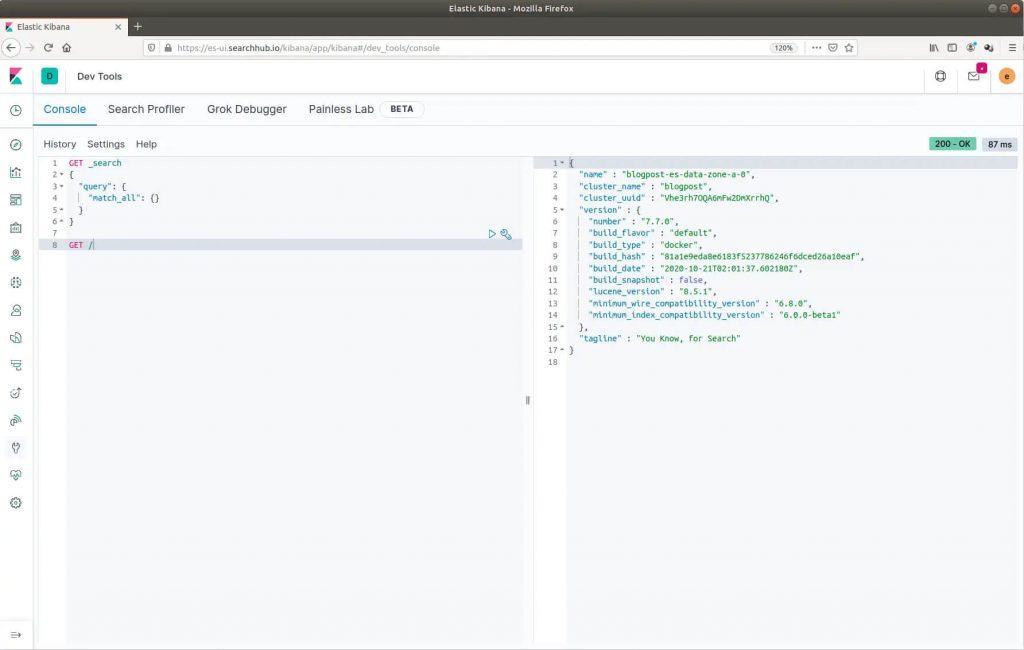
    Getting started with your Elasticsearch Deployment inside the Kibana Dev Tools

    Summary

    We now have an overview of all officially supported methods of installing/operating Elasticsearch. Additionally, we successfully set up a cluster which met the following requirements:

    • 6 node clusters (3 es-master, 3 es-data)
    • we spread master and data nodes over 3 availability zones
    • installed a plugin to snapshot data on S3
    • has dedicated nodes in which only elastic services are running
    • upholds the constraints that no two elastic nodes of the same type are running on the same machine


    Thanks for reading!

    Full List of Deployment Files

    				
    					apiVersion: v1
    kind: Namespace
    metadata:
      name: blog
    ---
    apiVersion: elasticsearch.k8s.elastic.co/v1
    kind: Elasticsearch
    metadata:
      name: blogpost
      namespace: blog
    spec:
      version: 7.7.0
      nodeSets:
      - name: master-zone-a
        count: 1
        config:
          node.master: true
          node.data: false
          node.ingest: false
          node.attr.zone: eu-north-1a
          cluster.routing.allocation.awareness.attributes: zone
        podTemplate:
          metadata:
            labels:
              component: elasticsearch
              role: es-master
          spec:
            volumes:
              - name: elasticsearch-data
                emptyDir: {}
            affinity:
              nodeAffinity:
                requiredDuringSchedulingIgnoredDuringExecution:
                  nodeSelectorTerms: 
                  - matchExpressions:
                    - key: kops.k8s.io/instancegroup
                      operator: In
                      values:
                      - es-master
                    - key: failure-domain.beta.kubernetes.io/zone
                      operator: In
                      values:
                      - eu-north-1a
              podAntiAffinity:
                preferredDuringSchedulingIgnoredDuringExecution:
                - weight: 100
                  podAffinityTerm:
                    labelSelector:
                      matchExpressions:
                      - key: role
                        operator: In
                        values:
                        - es-master
                    topologyKey: kubernetes.io/hostname
            initContainers:
            - name: sysctl
              securityContext:
                privileged: true
              command: ['sh', '-c', 'sysctl -w vm.max_map_count=262144']
            - name: install-plugins
              command:
              - sh
              - -c
              - |
                bin/elasticsearch-plugin install -b repository-s3
            tolerations:
            - key: "es-node"
              operator: "Equal"
              value: "master"
              effect: "NoSchedule"
            containers:
            - name: elasticsearch
      - name: master-zone-b
        count: 1
        config:
          node.master: true
          node.data: false
          node.ingest: false
          node.attr.zone: eu-north-1b
          cluster.routing.allocation.awareness.attributes: zone
        podTemplate:
          metadata:
            labels:
              component: elasticsearch
              role: es-master
          spec:
            volumes:
              - name: elasticsearch-data
                emptyDir: {}
            affinity:
              nodeAffinity:
                requiredDuringSchedulingIgnoredDuringExecution:
                  nodeSelectorTerms:
                  - matchExpressions:
                    - key: kops.k8s.io/instancegroup
                      operator: In
                      values:
                      - es-master
                    - key: failure-domain.beta.kubernetes.io/zone
                      operator: In
                      values:
                      - eu-north-1b
            initContainers:
            - name: sysctl
              securityContext:
                privileged: true
              command: ['sh', '-c', 'sysctl -w vm.max_map_count=262144']
            - name: install-plugins
              command:
              - sh
              - -c
              - |
                bin/elasticsearch-plugin install -b repository-s3
            tolerations:
            - key: "es-node"
              operator: "Equal"
              value: "master"
              effect: "NoSchedule"
            containers:
            - name: elasticsearch
      - name: master-zone-c
        count: 1
        config:
          node.master: true
          node.data: false
          node.ingest: false
          node.attr.zone: eu-north-1c
          cluster.routing.allocation.awareness.attributes: zone
        podTemplate:
          metadata:
            labels:
              component: elasticsearch
              role: es-master
          spec:
            volumes:
              - name: elasticsearch-data
                emptyDir: {}
            affinity:
              nodeAffinity:
                requiredDuringSchedulingIgnoredDuringExecution:
                  nodeSelectorTerms:
                  - matchExpressions:
                    - key: kops.k8s.io/instancegroup
                      operator: In
                      values:
                      - es-master
                    - key: failure-domain.beta.kubernetes.io/zone
                      operator: In
                      values:
                      - eu-north-1c
            initContainers:
            - name: sysctl
              securityContext:
                privileged: true
              command: ['sh', '-c', 'sysctl -w vm.max_map_count=262144']
            - name: install-plugins
              command:
              - sh
              - -c
              - |
                bin/elasticsearch-plugin install -b repository-s3
            tolerations:
            - key: "es-node"
              operator: "Equal"
              value: "master"
              effect: "NoSchedule"
            containers:
            - name: elasticsearch       
      - name: data-zone-a
        count: 1
        config:
          node.master: false
          node.data: true
          node.ingest: true
          node.attr.zone: eu-north-1a
          cluster.routing.allocation.awareness.attributes: zone
        podTemplate:
          metadata:
            labels:
              component: elasticsearch
              role: es-worker 
          spec:
            volumes:
              - name: elasticsearch-data
                emptyDir: {}
            affinity:
              nodeAffinity:
                requiredDuringSchedulingIgnoredDuringExecution:
                  nodeSelectorTerms:
                  - matchExpressions:
                    - key: kops.k8s.io/instancegroup
                      operator: In
                      values:
                      - es-data
                    - key: failure-domain.beta.kubernetes.io/zone
                      operator: In
                      values:
                      - eu-north-1a
            initContainers:
            - name: sysctl
              securityContext:
                privileged: true
              command: ['sh', '-c', 'sysctl -w vm.max_map_count=262144']
            - name: install-plugins
              command:
                - sh
                - -c
                - |
                  bin/elasticsearch-plugin install -b repository-s3
            tolerations:
            - key: "es-node"
              operator: "Equal"
              value: "data"
              effect: "NoSchedule"
            containers:
            - name: elasticsearch
      - name: data-zone-b
        count: 1
        config:
          node.master: false
          node.data: true
          node.ingest: true
          node.attr.zone: eu-north-1b
          cluster.routing.allocation.awareness.attributes: zone
        podTemplate:
          metadata:
            labels:
              component: elasticsearch
              role: es-worker 
          spec:
            volumes:
              - name: elasticsearch-data
                emptyDir: {}
            affinity:
              nodeAffinity:
                requiredDuringSchedulingIgnoredDuringExecution:
                  nodeSelectorTerms:
                  - matchExpressions:
                    - key: kops.k8s.io/instancegroup
                      operator: In
                      values:
                      - es-data
                    - key: failure-domain.beta.kubernetes.io/zone
                      operator: In
                      values:
                      - eu-north-1b
            initContainers:
            - name: sysctl
              securityContext:
                privileged: true
              command: ['sh', '-c', 'sysctl -w vm.max_map_count=262144']
            - name: install-plugins
              command:
                - sh
                - -c
                - |
                  bin/elasticsearch-plugin install -b repository-s3
            tolerations:
            - key: "es-node"
              operator: "Equal"
              value: "data"
              effect: "NoSchedule"
            containers:
            - name: elasticsearch
      - name: data-zone-c
        count: 1
        config:
          node.master: false
          node.data: true
          node.ingest: true
          node.attr.zone: eu-north-1c
          cluster.routing.allocation.awareness.attributes: zone
        podTemplate:
          metadata:
            labels:
              component: elasticsearch
              role: es-worker 
          spec:
            volumes:
              - name: elasticsearch-data
                emptyDir: {}
            affinity:
              nodeAffinity:
                requiredDuringSchedulingIgnoredDuringExecution:
                  nodeSelectorTerms:
                  - matchExpressions:
                    - key: kops.k8s.io/instancegroup
                      operator: In
                      values:
                      - es-data
                    - key: failure-domain.beta.kubernetes.io/zone
                      operator: In
                      values:
                      - eu-north-1c
            initContainers:
            - name: sysctl
              securityContext:
                privileged: true
              command: ['sh', '-c', 'sysctl -w vm.max_map_count=262144']
            - name: install-plugins
              command:
                - sh
                - -c
                - |
                  bin/elasticsearch-plugin install -b repository-s3
            tolerations:
            - key: "es-node"
              operator: "Equal"
              value: "data"
              effect: "NoSchedule"
            containers:
            - name: elasticsearch
    ---
    apiVersion: kibana.k8s.elastic.co/v1
    kind: Kibana
    metadata:
      name: ui
      namespace: ui
    spec:
      version: 7.7.0
      count: 1
      elasticsearchRef:
        name: ui
      podTemplate:
        metadata:
          labels:
            component: kibana