Blog

  • From Search Analytics to Search Insights – Part 1

    From Search Analytics to Search Insights – Part 1

    From Search Analytics to Search Insights – Part 1

    Over the last 15 years, I have been in touch with tons of Search Analytics vendors and services regarding Information Retrieval. They all have one thing in common: to measure either the value or the problems of search systems. In fact, in recent years, almost every Search Vendor has jumped on board, adding some kind of Search Analytics functionality in the name of offering a more complete solution.

    How to Make Search Analytics Insights Actionable

    However, this doesn’t change the truth of the matter. To this day, almost all customers with whom I’ve worked over the years massively struggle to transform the data exposed by Search Analytics Systems into actionable insights that actively improve the search experiences they offer to their users. No matter how great the marketing slides or how lofty the false promises are, new tech can’t change that fact.

    The reasons for this behavior are anything but obvious for most people. To this end, the following will shed some light on these problems and offer recommendations on how best to fix them.

    Query Classifier

    First of all, regardless of the system you are using, the data that gets collected needs to be contextual, clean, and serve a well-defined purpose. I can’t overstate the significance of the maintenance and assurance of data accuracy and consistency over its entire lifecycle. It follows that if you or your system collect, aggregate, and analyze wrong data, the insights you might extract from it are very likely fundamentally wrong.

    As always, some examples to help frame these thoughts in terms of your daily business context. The first one refers to zero-result searches and the second deals with Event-Attribution.

    Zero-Results

    It’s common knowledge among Search-Professionals that improving your zero-result-queries is the first thing to consider when optimizing search. But what they tend to forget to mention is that understanding the context of zero-result queries is equally essential.

    There are quite a few different reasons for zero-result queries. However, not all of them are equally insightful when maintaining and optimizing your search system. So let’s dig a bit deeper into the following zero-result cases.

    Symptom Reason Insightfulness

    Continuous zero-result

    Search system generally lacks suitable content.

    Language gap between users and content or information

    Search system generally lacks suitable content.

    Language gap between users and content or information

    Temporary zero-result


    The search system temporarily lacks suitable content.
    a) Filtered out content that is currently unavailable.
    b) Possible inconsistency during re-indexation.
    c) Search-Service Time-Outs (depending on the type of tracking integration and technology)

    a) partially helpful – show related content.
    b) not very helpful

    c) not very helpful

    Context is King

    As you can see, the context (time, type, emitter) is quite essential to distinguish between different zero-result buckets. Context allows you to see the data in a way conducive to furthering search system optimization. We can use this information to unfold the zero-result searches and discover which offer real value acting as the baseline for continued improvements.

    Human Rate

    Almost a year ago, we started considering context in our Query Insights Module. One of our first steps was to introduce the so-called “human rate” of zero results. As a result, our customers can now distinguish between zero results from bots and those originating from real users. This level of differentiation lends more focus to their zero results optimization efforts.

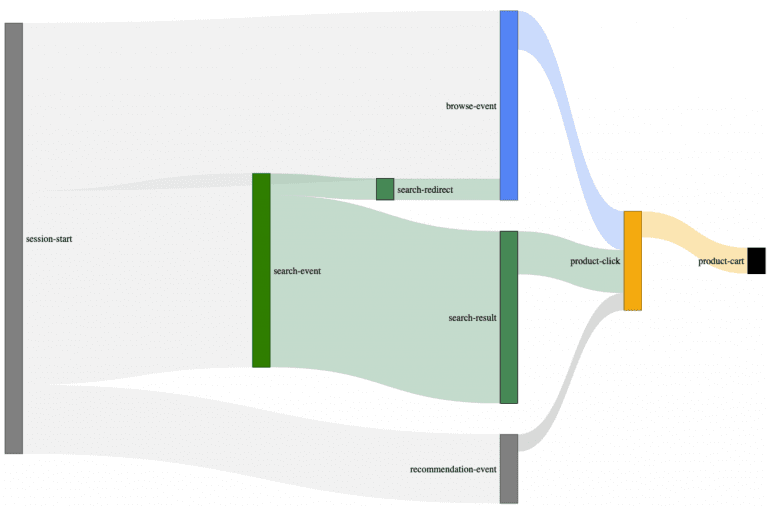
    Let’s use a Sankey-diagram, with actual customer data (700.000 unique searches) to illustrate this better:

    Using a sample size of 700.000 unique searches, we can decrease the initial 46.900 zero-results (6.7% zero-result-rate) to 29.176 zero-results made by humans (4.17% zero-result-rate); a reduction of almost 40% compared to the original sample size, just by adding context.

    Session Exits

    Another helpful dimension to add is session exits. Once you’ve distinguished between zero-results that lead to Session-Exits, from those ending successfully, what remains is a strong indicator for high-potential zero-result queries in desperate need of some optimization.

    And don’t forget:

    “it’s only honest to come to terms with the fact that not every zero-result is a dead-end for your users, and sometimes it is the best you can do.”

    Event Attribution Model

    Attribution modeling gets into some complex territory. Breaking down its fundamentals is easy enough, but understanding how they relate can make your head spin.

    Let’s begin by first trying to understand what attribution modeling is.

    Attribution modeling seeks to assign value to how a customer engaged with your site.

    Site interactions are captured as events that, over time, describe how a customer got to where they are at present. In light of this explanation, attribution modeling aims to assign value to the touch-points or event-types on your site that influence a customer’s purchase.

    For example: every route they take to engage with your site is a touch-point. Together, these touch-points are called a conversion path. It follows that the goal of understanding your conversion paths is to locate which elements or touch-points of your site strongly encourage purchases. Additionally, you may also gain insights into which components are weak, extraneous, or need re-working.

    You can probably think of dozens of possible routes a customer might take in an e-commerce purchase scenario. Some customers click through content to the product and purchase quickly. Others comparison shop, read reviews, and make dozens of return visits before making a final decision.

    Unfortunately, the same attribution models are often applied to Site Search Analytics as well. It is no wonder then that hundreds of customers have told me their Site-Search-Analytics is covered by Google, Adobe, Webtrekk, or other analytics tools. However, whereas this might be suitable for some high-level web analytics tasks, it turns problematic when researching the intersection of search and items related to site navigation and how these play a role in the overall integrity of your data.

    Increase Understanding of User Journey Event Attribution

    To increase the level of understanding around this topic, I usually do a couple of things to illustrate what I’m talking about.

    Step 1: Make it Visual

    To do this, I make a video of me browsing around their site just like a real user would using different functionalities like Site-Search, selecting Filters, clicking through the Navigation, triggering Redirects, clicking on Recommendations. At the same time, I ensure we can see how the Analytics System records the session and the underlying data that gets emitted.

    Step 2: Make it Collaborative

    Then, we collaboratively compare the recording and the aggregated data in the Analytics System.

    Walk your team through practical scenarios. Let them have their own “Aha” Experience

    What Creates an Event Attribution “Aha” Effect?

    More often than not, this type of practical walk-through produces an immediate “Aha” experience for the customer when he discovers the following:

    1. search-related events like clicks, views, carts, orders might be incorrectly attributed to the initial search if multiple paths are used (i.e., redirects or recommendations)
    2. Search redirects are not attributed to a search event at all.
    3. Sometimes buy events and their related revenue are attributed to a search event, even when a correlation between buy and search events is missing.

    How to Fix Event Attribution Errors

    You can overcome these problems and remove most of the errors discussed but you will need to be lucky enough to have some tools.

    Essential Ingredients for Mitigating Event Attribution Data Errors:

    1. Raw data
    2. A powerful Data-Analytics-System
    3. Most importantly: more profound attribution knowledge.

    From here, it’s down to executing a couple of complex query statements on the raw data points.

    The Most User-Friendly Solution

    But fortunately, another more user-friendly solution exists. A more intelligent Frontend Tracking technology will identify and split user-sessions into smaller sub-sessions (trails) that contextualize the captured events.

    That’s the main reason why we developed and open-sourced our search-Collector. It uses the so-called trail concept to contextualize the different stages in a user session, radically simplifying accurate feature-based-attribution efforts.

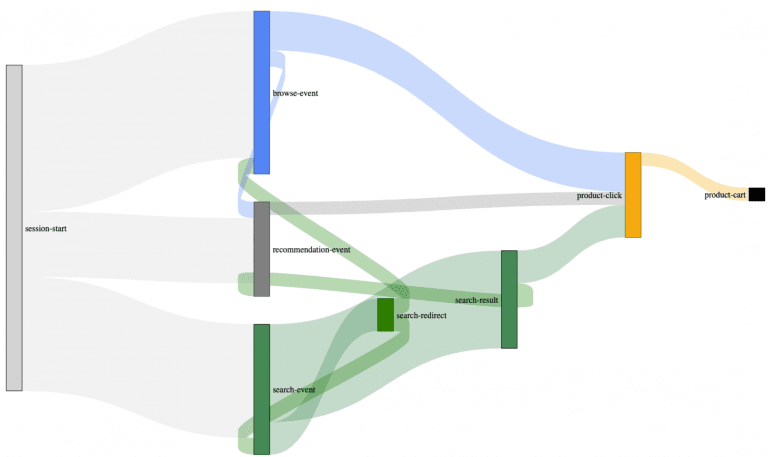
    Example of an actual customer journey map built with our search-collector.

    You may have already spotted these trail connections between the different event types. Most user sessions are what we call multi-modal trails. Multi-modal, in this case, describes the trail/path your users take to interact with your site’s features(search, navigation, recommendations) as a complex interwoven data matrix. As you can see from the Sankey diagram, by introducing trails (backward connections), we can successfully reconstruct the user’s paths.

    Without these trails, it’s almost impossible to understand to which degree your auxiliary e-commerce systems: like your site-search, contribute to these complex scenarios.

    This type of approach safeguards against overly focusing on irrelevant functionalities or missing other areas more in need of optimization.

    Most of our customers already use this type of optimization filtering to establish more accurate, contextualized insight regarding site search.

  • How to easily add AI to your Auto-Complete (Suggest) functionality?

    How to easily add AI to your Auto-Complete (Suggest) functionality?

    How to easily add AI to your Auto-Complete
    (Suggest) functionality?

    In his previous article, my colleague Andreas described the general importance of instant auto-complete suggest functionality in the eCommerce space. If done right – it’s a great tool to lead your visitors to their desired products. This functionality becomes ever more necessary and plays a crucial role in your customers’ overall experience, especially in light of the increase in mobile traffic to e-commerce sites.

    What are the Essential requirements for SmartSuggest from a User Perspective?

    1. SmartSuggest needs to be fast and data (keywords, products, brands, content, etc.) always up-to-date.
    2. SmartSuggest needs to surface relevant results from the first character typed into the search box.
    3. SmartSuggest needs to handle typos and misspellings in the same way your search technology does.
    4. SmartSuggest needs to understand the intent, location, and context of your search visitors.

    Unfortunately, most eCommerce agencies, search vendors, e-com platforms, and in-house search teams struggle to deliver this kind of experience within their Auto-Complete (Suggest) user journeys. If there was ever a doubt: Search is not a trivial task!

    Why is Search so Business Relevant? Let’s dig a bit deeper.

    A brief look at the most common reasons your current site-search solution needs optimization:

    • Most “suggest tools” only handle product data or log files containing search history.
    • Suggest Tools fail to consider valuable search KPI data.
    • Lack of sophisticated search tracking.
    • The most significant amount of time and effort goes into UI developments.
    • Most suggest functionalities cannot add short phrases, e.g. “ap,” to familiar brand names, like “apple,” to identify intent better.
    • Your current search tool is not performing at its potential.

    How can SearchHub help? The solution!

    The foundation of our approach lies in collecting the right data within a customer search journey. SearchHub then uses its AI framework to cluster search terms and autonomously choose the most valuable term. Then, once enough data has been gathered to make a proper decision, pick a MasterQuery for relevant clusters. In this way, we ensure your search understands your audience.

    SmartSuggest following initial learning phase.

    Suggestions with spell correction and trend sorting

    SearchHub SmartSuggest runs in combination with whatever site-search technology our customers have in place. To preface, we’re not replacing what our clients have; we make it more clever. For example: whether you already use an open-source search framework (e.g., Elasticsearch, SolR, or OCSS) or still trust in your proprietary search vendor solution. SmartSuggest sits in front of your site-search and makes sure it understands your audience.

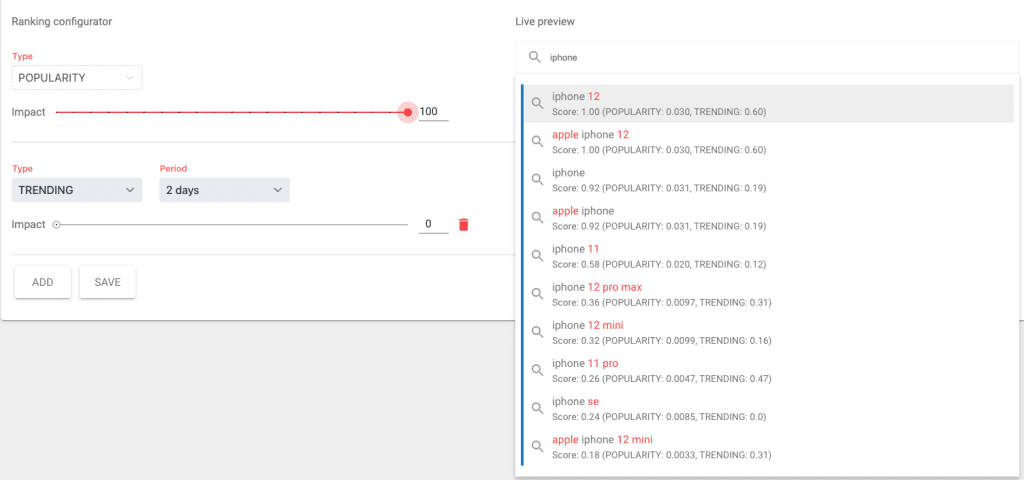
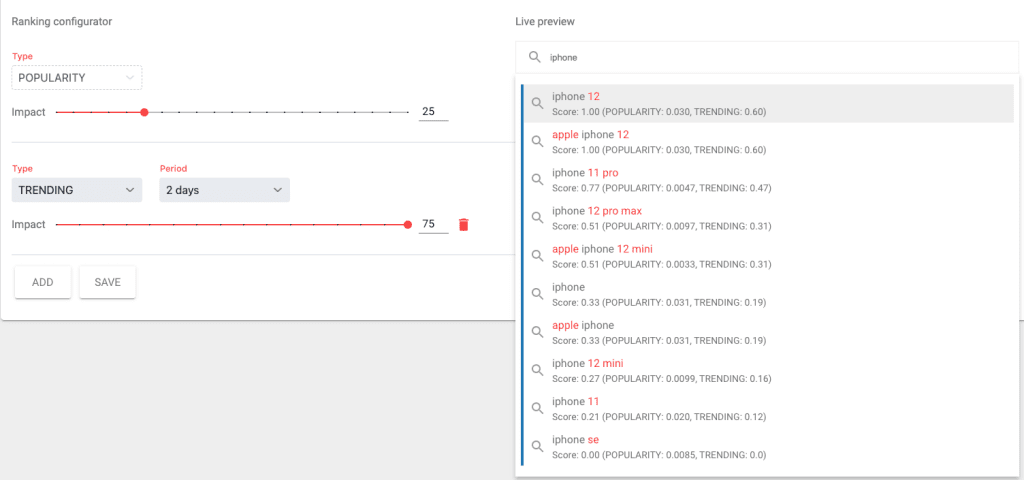
    Going a step further: by adding our SearchInsights module (specially designed for eCommerce site-search optimization) to the mix, you will be able to influence your SmartSuggest rankings according to keyword trends and/or conversion rates.

    👍Without trend influence (out of the box):

    👌With trend influence (using SearchInsights):

    This data-driven philosophy is so imperative to a good customer experience that we invented a findability score. Findability represents a weighted ratio between positive and negative user signals for a given Search Term. What does this mean? We consider things like exits, bounces, no-clicks, and long search paths to be negative signals. On the other hand, positive signals are things like clicks, rate of clicks on the first page of results, carts, and buys. A bonus: on top of our best-practice KPIs, you have the flexibility to define your own signals.

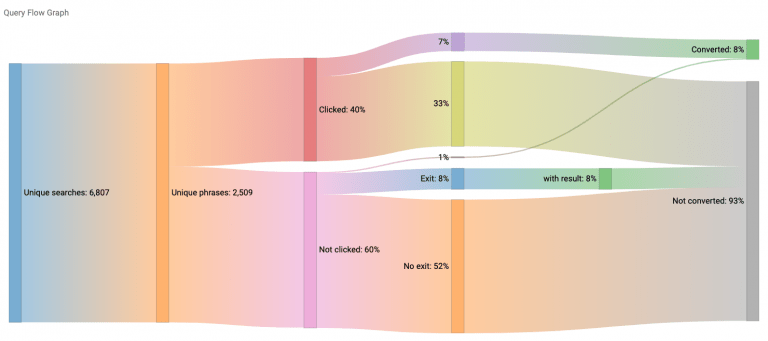
    Query-Flow Graph (SearchInsights Module):

    SearchInsights Query Flow Graph

    Last but not least: SmartSuggest keeps track of the search redirect and merchandising landing pages your team maintains. Detecting your merchandising & personalization rules means we always direct your visitors to the appropriate curated landing page.

    Should I replace my existing Auto-Complete / Suggest and UI?

    No, absolutely not. SmartSuggest works in concert with your current search tech stack. One button in the SearchHub UI is all you have to click to fire up your SmartSuggest service. This tech sits on the same data-driven foundation as our MasterQuery picking technology.

    Click here to skip our customer case and call us directly to find out more!

    Customer who combined technologies

    Have a look at STEG Electronics for a masterfully executed example. I’ll walk you through some details here.

    STEG already had an elasticsearch stack in place when we introduced Malte Polzin (CEO at STEG Electronics AG ) and his team to SearchHub. However, the prospect of having to implement the complete logic necessary to build a state-of-the-art suggest experience quickly led to the STEG team opting for a hybrid solution. It was clear that combining the data-driven knowledge base of SearchHub with their previously implemented suggest UI would be an innovative and efficient approach. Following a brief search-data-collection-period to gather all relevant search KPIs SmartSuggest was live.

    STEG – initial SmartSuggest trend sorting

    “SearchHub gives us the flexibility to develop our unique eCommerce search solution based on Elasticsearch with a data-driven approach. The search experience we deliver to our clients is essential for us, and SearchHub supports us with unique expertise in this area. ” Malte Polzin, CEO STEG Electronics AG.

    STEG – SmartSuggest Trends even on Typos

    Typos and misspellings are handled autonomously by the SearchHub knowledge base. As a result, expensive, time-consuming algorithm operations are not necessary.

    Using SmartQuery suggestions allows STEG visitors to browse a list of dynamically-ranked keyword suggestions. The unique way in which the customer interacts with the list of keywords is quite clever. SearchHub’s SmartSuggest displays suggestions based on what’s trending or most valuable at the moment. This data-driven result sorting opens the door facilitates a remarkable user experience! Most notably, mobile device navigation is more usable. Customers select relevant criteria (attributes, tags, variables, etc.) right from SmartSuggest. This is an ingenious answer to the problem of how to handle facetted search on a mobile device. The customer narrows their search to precisely what they’re looking for, all before clicking on the actual “search” button. As a result, customers find what they’re looking for more quickly.

    On top of that, STEG saves the cost of unnecessarily querying their site-search engine for terms already known to be of high value.

    STEG Filters on Trends

    How do I benefit from SearchHub and make auto-complete data-driven?

    All you have to do is add your search tracking data (e.g., Google Analytics) to SearchHub or include our SearchCollector in your Tag Manager. Then, within a mere matter of days, depending on the size of your online business, we provide you with SmartSuggest functionality ready to use as a stand-alone or hybrid solution.


    What else do you get?

    • Maintain SmartSuggest within your SearchHub UI. Find out more here.
    • Add multiple Suggest labels to keyword clusters.
    • Manipulate and test your SmartSuggest ranking strategy with a live preview.
    • Merchandise SmartSuggest with inspirational redirect campaigns.

    What does your tech team need to know?

    SmartSuggest uses enriched keywords from the searchhub clusters database to generate a sophisticated suggest functionality. Designed on Apache Lucene to provide fast, weighted query suggestions. This particular style of deployment is part of the “Open Commerce Search Stack.” If chosen for your implementation, this module automatically connects the searchhub API retrieving the necessary search KPIs and returning detailed analysis data. Combined with performance figures about the module and its usage, you get a turnkey solution to optimize any site search from top to bottom.

    We recommend referencing our sample user story to help get you started with SmartSuggest in your system. Additionally, you can reference our SmartSuggest integration material here.

    We are happy to provide a demo environment and support you with your e-commerce search strategy, any time!

  • Find Your Application Development Bottleneck

    Find Your Application Development Bottleneck

    Find Your Application
    Development Bottleneck

    A few months ago, I wrote about how hard it is to auto-scale people. Come to think of it, it’s not hard. It’s impossible. But, fortunately, it works pretty well for our infrastructure.

    When I started my professional life more than 20 years ago, it became more and more convenient to rent a hosted server infrastructure. Usually, you had to pick from a list of potential hardware configurations your favorite provider was supplying. At that time, moving all your stuff from an already running server to a new one wasn’t that easy. As a result, the general rule-of-thumb was to configure more MHz, MB, or Mbit than was needed during peak times to prepare for high season. In the end, lots of CPUs were idling around most of the year. It’s a bit like feeding your 8-month-old using a bucket. Your kid certainly won’t starve, but the mess will be enormous.

    Nowadays, we take more care to efficiently size and scale our systems. With that, I mean we do our best to find the right-sized bottle with a neck broad enough to meet our needs. The concept is familiar. We all know the experiments from grade school comparing pipes with various diameters. Let’s call them “bottlenecks.” The smallest diameter always limits the throughput.

    A typical set of bottlenecks looks like this:

    Of course, this is oversimplified. There’s also likely to be a browser, maybe an API-Gateway, some firewall, and various NAT-ting components as well in a real-world setting. All these bottlenecks directly impact your infrastructure. Therefore, it’s crucial for your application that you find and broaden your bottlenecks in a way that enough traffic can fluently run through them. So let me tell you three of my favorite bottlenecks of the last decade:

    My Three Favorite Application Development Bottlenecks

    1. Persistence:

    Most server systems run on a Linux derivative. When an application creates data (regular files, logfiles, search indexes) to some kind of persistence in a Linux system, it is not written immediately. Instead, the Linux kernel will tell your application: “alright, I’m done,” although it isn’t. Instead, the data is temporarily kept in memory – which may be 1000 times faster than actually writing it to a physical disk. That’s why it’s no problem at all if another component wants to access that same data only microseconds later. The Linux kernel will serve it from memory as if read from the disk. That’s one of the main breakthroughs Linus Torvalds achieved with his “virtual machine architecture” in the Linux kernel (btw: Linus’ MSc thesis is a must-read for everyone trying to understand what a server is actually doing. In the background, the kernel will, of course, physically write the data to the disk. You’ll never notice this background process as long as there is a good balance between data input and storage performance. Yet, at some point, the kernel is forced to tell your application: “wait a second, my memory is full. I need to get rid of some of that stuff.” But when exactly does this happen?

    Execute the following on your machine: sysctl -a | grep -P “dirty_.*_ratio”

    Most likely you’ll see something like vm.dirty_background_ratio = 10
vm.dirty_ratio = 20_

    These are the defaults in most distributions. vm.dirty_ratio is the percentage of RAM that may be filled with unwritten data before it is forced to be written to disk. These values were introduced many years ago when servers had far less than 1 GB of RAM. Imagine a 64GB server system and an application that is capable of generating vast amounts of data in a short time. Not that unusual for a search engine running a full update on an index or some application exporting data. As soon as there are 12.8GB of unwritten data, the kernel will more or less stop your system and write 6.4GB physically to the disk until the vm.dirty_background_ratio limit is reached again. Have you ever noticed a simple “ls” command in your shell randomly taking several seconds or even longer to run? If so, you’re most likely experiencing this “stop-the-world! I-need-to-sync-this-data-first.” How to avoid such behavior and adequately tune your system to keep it from coming back again may be crucial in fixing this random bottleneck. Read more in Bob Planker’s excellent post – it dates a few years back yet still fresh as ever: I often find myself coming back to it. You may want to set a reasonably low value for dirty_ratio to avoid long suspension times in many cases.

    BTW: want to tune your dev machine? Bear in mind that your IDE’s most significant task is to write temporary files (.class files to run a unit-test, write .jar files that will be recreated later anyway, node packages, and so on), so you can increase the vm.dirty_ratio to 50 or more. On a system with enough memory, this will render your slow IDE into a blazingly fast in-memory-IDE.

    2. Webserver:

    I love web servers. They are the Swiss Army Knife of the internet. Any task you can think of they can do. I’ve even seen them perform tasks that you don’t think about. For example, they can tell you that they are not the coffee machine, and you mistakenly sent your request to the teapot. Webservers accomplish one thing extraordinarily well: they act as an interface for an application server. Quite a typical setup is an Apache Webserver in front of an Apache Tomcat. Arguably, this is not the most modern of software stacks, but you’ll be surprised how many companies still run it.

    In an ideal world, the developer team manages the entire request lifecycle. After all, they are the ones who know their webserver and develop the application that runs inside the tomcat appserver. As a result, they have sufficient access to the persistence layer. Our practical experience, however, leaves us confronted with horizontally cut responsibilities. In such cases, Team 1 is webserver; Team 2 takes care of the Tomcat; Team 3 develops the application, and Team 4 is the database engineers. I forgot about the load balancer, you say? Right, nobody knows precisely how this works, we’ve outsourced it.

    One of my most favorite bottlenecks, in this scenario, looks something like the following. All parties did a great job developing a lightning-fast application that only sporadically has to execute long-running requests. Further, the database has been fine-tuned and set up with the appropriate indexes. All looks good, so you start load-testing the whole setup. The CPU-load on your application slowly ramps up; everything is relaxed. Then, suddenly, the load-balancer starts throwing health-check errors and begins marking one service after the other as unresponsive. After much investigation, tuning the health-check timeout, and repeatedly checking the application, you find out that the Apache cannot possibly serve more than 400 parallel requests. Why not? Because nobody thought to configure its limits so it’s still running on the default value:

    Find your bottlenecks! Hard to find and easy to fix

    3. Application:

    Let’s talk about Java. Now, I’m sure you’ve already learned a lot about garbage collection (GC) in Java. If not – do so before trying to run a high-performance-low-latency application. There are tons of documents describing the differences between the built-in GCs – I won’t recite them all here. But there is one tiny detail I haven’t seen or heard of almost anywhere:

    The matrix-like beauty of GC verbose logging

    Have you ever asked yourself whether we live in a simulation? Although GC verbose logging cannot answer this for your personal life, at least it can answer it for your Java application. Imagine a Java application running on a VM or inside a cloud container. Usually, you have no idea what’s happening outside. It’s like Neo before swallowing the pill (was it the red one? I always mix it up). Only now, there is this beautiful GC log line:

    2021-02-05T20:05:35.401+0200: 46226.775: [Full GC (Ergonomics) [PSYoungGen: 2733408K->0K(2752512K)] [ParOldGen: 8388604K->5772887K(8388608K)] 11122012K->5772887K(11141120K), [Metaspace: 144739K->144739K(1179648K)], 3.3956166 secs] [Times: user=3.39 sys=0.04, real=23.51 secs]

    Did you see it? There is an error in the matrix. I am not talking about a full GC running longer than 3 seconds (which is unacceptable in a low-latency environment. If you’re experiencing this behavior, consider using another GC). I am talking about the real-world aging 23.51 seconds while your GC doesn’t do anything. How is that even possible? Time elapses identically for host and VM as long as they travel through the universe at the same speed. However, if your (J)VM says: “Hey, I only spent 3.39 seconds in GC while the kernel took 0.04 seconds. But wait a minute, in the end, 23.51 seconds passed. Whaa? Did I miss the party?” In this case, you’ll know quite for sure that your host system suspended your JVM for over 20 seconds. Why? Well I can’t begin to answer the question for your specific situation, but I have experienced the following reasons:

    • Daily backup of ESX cluster set to always start at 20:00 hrs.
    • Transparent Hugepages stalling the whole host to defrag memory (described first here)
    • Kernel writing buffered data to disk (see: Persistence)

    Additionally, there are other expedient use cases for using the GC logs for analysis (post-mortem analysis, tracking down suspension times in the GC, etc.). Before you start spending money on application performance monitoring tools, activate GC logging – it’s for free: -verbose:gc -XX:+PrintGCDateStamps -XX:+PrintGCDetails -Xloggc:/my/log/path/gclog.txt

    Rest assured, finding and eliminating your bottlenecks is an ongoing process. Once you’ve increased the diameter of one bottle, you have to check the next one. Some call it a curse; I call it progress. And, it’s the most efficient use of our limited resources. Much better than feeding your kid from a bucket.


  • How to Cook Soup in a Team – And not Spoil it

    How to Cook Soup in a Team – And not Spoil it

    How to Cook Soup in a Team
    – And not Spoil it

    13% of all startups fail due to a lack of harmony within the team. We know this and have no intention of adding to that statistic. A year ago, I had the privilege of joining this incredible team of individuals to be a part of this startup. During the last year, I’ve watched the quality of our technology grow congruent with the rate of personality development. And I’d like to tell you about it.

    How my searchhub journey began

    Stepping into the office in the heart of Pforzheim, situated directly on the north bank of the river Enz, I knew I had no idea where this was going to lead. One thing I did know, however; these are people I believe in. And so it began.

    Initial 500 Errors

    My responsibilities at the company, as is the case with all startups, are pretty broadly defined. Sales, Marketing, and PR. Immediately after joining, I began reviewing which areas made the most sense for my immediate focus. Next, I started building out this blog and creating some pretty cool videos to train our quickly growing customer base on using our software.

    These new territories, possible strategies, and tasks quickly led to a readjustment and questions within the team. Unfortunately, the result wasn’t always a mature adult conversation. In fact, at one point, early on, I was involved in a particularly immature antagonistic conflict in which I was the aggressor. Of course, I had my reasons for unreasonableness, and so too my colleague. And to make matters worse, I come from a liberal arts background and work all day with IT Gurus. It’s safe to say, I was feeling more than a little self-righteous about my communication abilities. The ensuing conflict and subsequent resolution caught me all the more off guard.

    Humbled by the emotionally inept

    It’s generally accepted that IT nerds are rather limited when it comes to emotional intelligence. So I was feeling somewhat smug, believing my communication skills were greater than those of my colleague. Quite presumptuous considering the circumstances of the conflict (my desire to protect my ego was standing in the way of a solution). Imagine my surprise when none other than an IT nerd colleague schooled me in a more noble manner of communication.

    Let’s take a step back for clarification. You see, the same day of the conflict, a different colleague (part of the IT Crowd) approached me about the incident. This is the kind of guy I was talking about earlier. You know the brilliant, emotionally deficient type. Only… he’s not.

    My colleague explained to me (the trained pastor and communication expert who should have known better) how he would like such conversations to go in the future in a friendly and respectful tone. They should be held in private, both parties should remain respectful. And if it becomes apparent that there is no way of coming together around the topic of disagreement, agree to disagree and move on. It’s what’s best for the consistent progress of the company. How could I disagree?

    He was right. And I was humbled.

    Luckily, I’m not the only one in the company who’s had the privilege of experiencing this type of reflection and good guidance from a colleague. It’s becoming part of our culture.

    Discovering Our New Identity as Soup Chefs!

    In the context of a startup, everyone must pull their weight. We haven’t the time, resources, or funds to waste with people not willing or unable to be a part of progressing our technology and market footprint. Everything and everyone counts.

    How this plays out from a technical point of view is pretty straightforward. Flat hierarchies, scrum meetings, everyone is heard no-one walks alone.

    The underlying communication, however, is more tricky. Communication is often seen as something we naturally do.

    The misnomer: everyone is already invested in the vision and direction of the startup. This unites us and precludes any need to place an extra focus on interpersonal communication.

    Unfortunately, being a good communicator is all but natural. Even teams seemingly working towards the same goal are comprised of individuals, each with his or her own unique dependencies. These dependencies act as a kind of built-in bias, preventing pure objectivity.

    Now, just add Corona, and home office to the mix, and baaam, you gotta recipe for disaster.

    Anyone Can Spoil a Soup

    Let’s stick with the recipe example and build on this illustration. Imagine you own a startup soup company. Everyone in the business is responsible for certain parts of the revolutionary soup. Once a day, we come together to talk over our soup-making experience from the day before. If the context permits, we, objectively, offer our outside perspective. So far, so good. Then everyone goes back to cooking his or her own soup. The main ingredient is always the same. We simply add different spices, varieties, and amounts. These spices create unique associations with the soup that our colleagues are not having in the same way.

    What’s more: everyone likes a different kind of spice in their soup. So even though we use the same words to describe our experiences, each of us has a unique image of what those words mean. Details are lost as a result of missing context.

    To make matters more challenging. Even if we had the same context (identical spices and amounts), our lack of objectivity would be our guiding bias.

    What’s more, in the case of a real startup, daily meetings are not the place to go into detail. As a result, potential misunderstandings go unidentified. And in the background, more spices and seasonings are added, everyone secretly hoping not to deviate too far from the original plan. Working toward the same goal, building the business. I mean: how bad could it get? After all, we all use the same words to describe our experiences. It must be right. And then…

    Someone commits some code, makes a software purchase, writes an article for the press, generally does their best to progress our beloved technology.

    It’s at this moment it becomes apparent that something has gone wrong. Perhaps still a bit early to acknowledge as a communication problem, a conflict ensues. Blame and quick fixes are rolled out en masse to try and get a grasp on the situation.

    Only later does it become clear that all the Daily’s, all the technology conversations, all the references to the soup, its consistency and taste were not verified or even verifiable. Truth be told, some part of us willfully avoided difficult conversations where we would be forced to articulate what we mean. Instead, hiding behind phrases like “add just a little salt” or “more than enough pepper.”

    Keeping a conversation purely factual allows us to hide our personal preferences behind coded phrases and generally acceptable jargon without needing to explain ourselves. However, upon returning to our desks and finding ourselves confronted with a challenging piece of code, or a decision of preference, our natural fallback will always be what is most comfortable to us. Not what has the greatest consensus.

    So the question is: how to close the gap between the best outcome for the business and what is most practical for the individual? This is the heart of communication and the essence of self-leadership.

    Refining Technology – Rethinking Communication

    Refining this communication process improves the character and leadership qualities of the people communicating and has the harmonious effects of increasing the quality of business output and customer happiness.

    The negative consequences of ignoring better communication manifest themselves differently depending on your business. For the soup company, poor internal communication means sour soup. For searchhub.io, it means: our software development and customer satisfaction suffer. Or to use a more common IT expression: garbage in, garbage out.

    Successful Startups are like Meals, not Ingredients

    We’re small, privately owned, and funded. As a result, we can make quick changes. So a couple weeks ago, our team came together to talk about communication and its affect on our software quality. We left with a better understanding of where we failed to communicate more boldly at earlier communication processes. Stages at which it would still have been possible to avoid personal conflict and ultimate software errors.

    Moving forward, we determined to focus on different types of communication throughout the software development process. We need something more strategic than a “Daily,” but less formal than a company meeting and more weighty than a one-on-one technical conversation. A space in which the technical side is heard, but reading between the lines and calling each other out is equally accepted and conducive to a positive outcome. And… it all needs to be accessible to employees both in the office and home office regularly.

    How the hell is that going to work?

    Preliminary ideas range from small group meetings to discuss personal views about company issues to larger team gatherings with professional moderation. Our goal is to make our working environment as conducive to production as possible. Learning to resolve conflicts without sacrificing your own standpoint, or feeling beaten down by the owners, is key to creating an environment where everyone can develop and perform from a position of strength.

    Fixing Server Errors

    Facilitating communication is like fixing a server error. The goal is not to change the function of the server. On the contrary, only by resolving the error are all the pieces of the server able to communicate with each other at their designed speeds, ensuring the best performance. So too, in the case of communication. More focussed communication aims not to disrupt natural conversation flow but rather to raise the profile of each participant ensuring confidence and a level playing field for all parties involved.

    But there’s a blinding difference between fixing server errors and learning to communicate better. Unlike machines, words and context matter to humans. So ensuring positive future outcomes within your team is not simply about obtaining a better understanding of what it takes to make communication run smoothly and then redeploying.

    Redeploy

    In software, if an error is found, all it takes is fixing it and redeploying. Humans, however, don’t forget. We remember what went before, leaving an open window for trust issues and power abuses, which can take months if not years to recover from.

    As a result, being aware of what it means to communicate well also means applying the rules you learn. These rules act as a safeguard ensuring the success and innovation of your business not only in the short term for your current crisis but, more importantly, for the longevity of your company in general.

    Conclusion

    We’re a new company basking in the light of a bright future. We have intelligence, practical genius, a good network, and a strong work ethic. In short: the sky’s our neighborhood. 😉

    We acknowledge that we struggle communicating through inherent bias, personal preference, and big egos. Nevertheless, we are choosing daily to devote ourselves to better communication practice despite our inadequacies. I hope you do too.

  • Why Your Source Code is Less Important than You Think

    Why Your Source Code is Less Important than You Think

    Why Your Source Code is
    Less Important than You Think

    Have you ever thought of publishing the code you built for your company? Or even tried to convince your project lead to do so? Assume you created a remarkable and successful product. Maybe an excellent app in the app store. Now go and publish the source code!

    Why Open-Source is the Right Thing To Do

    It feels dangerous. Maybe even insane!

    Other than the obvious that you should only do it for a good reason, I don’t believe anything would happen. Let me tell you why I think your source code is less important than you think.

    A puzzle is more than its pieces.

    As you might know, we build and provide a SaaS optimization solution for e-commerce search. Lately, we have had several discussions about several algorithms and features. I found it remarkable how much background knowledge everyone in the team has piled up in their brain! If we were to give you all our source code, and none of the context we carry around with us every day, I bet you would have a hard time building a business around it. Not because the code quality is so bad or poorly documented. Even if you know the technology stack and understand what we do, you still would be hard-pressed to wrap your head around it. Why is that?

    No pain, no gain

    First of all, I think it has to do with you not being part of our journey! If no one explains it to you, you would not understand why we did several things the way we did.

    Last week a colleague wanted to reimplement a part of some complicated and faulty algorithm. I encouraged him to use an approach I tried and failed before. “Why will it work this time?” He asked. Good question. “Some of the conditions changed; that’s why it should work this time.”

    After some more discussions, we agreed on another approach.

    You see: Just having some technology or some fancy algorithm in place won’t make it work. You may end up building strange-looking code just because you imagine the problem in a very unique and specific way. That’s not bad. It’s just important that it works. At the very least, you and your mates must understand it. But for others, on the outside, it might get hard to follow. You will only ever comprehend the code if you grasp the same “mental model” we have.

    No passion, just bytes

    The problem described is a very particular example. Let’s take a step back. Assuming you understood it all and managed to make it run, what’s missing? Users. Customers. How will you get them? Do you have the same passion for presenting it? Have you understood the actual problem we solve and all the use-cases we see?

    A product is just as good as the weakest part of the people providing it. You can have the best source code, but in lack of people representing it, the product will stay what it is: some bytes in oblivion. However, it’s also the other way around. You can have fantastic marketing and excellent sales, but if your product is shit, its documentation hated, and your support team sucks (read more about why you should solve that), you can’t hold the customers for long.

    No vision, no mission

    Also, while you might be busy wrapping your head around it and making it run, we are already several steps ahead. You can’t imagine how many ideas we have. The more we work on solving this specific problem in e-commerce search, the more potential we see in it. With every change and every tiny new feature, we solve another problem – some of them the users haven’t even seen before. And they like it. It feels like being on the fast track. And the longer we are, the more speed we gain.

    Can you get on that track as well? Not just by taking parts of it.

    Prove me wrong!

    Still not convinced? Last few months, I was working on Open Commerce Search. I had the honor of being part of a great project with it. Guess what: it went live a few weeks ago. I still can’t believe it. It works! 😉

    So. Around 90% of the code I wrote is open source. I already wrote several times about it, producing a sweeping guideline that was the backbone for it. It is ready to use.

    Will you be able to build a successful e-commerce site search solution with it? No? Let me guess – you need more than just source code.

    Nevertheless, you should try and experience the potential of how OCSS simplifies and compensates for major flaws of using Elasticsearch for document and product search.

    But generally speaking, I hope to have encouraged you to take the plunge into releasing your source code when the time is right. Many projects reap tremendous rewards once made public. And remember, the final product is always more than the sum of its parts.

    Want to become a part of our great team and the thrilling products we create? We are hiring!

  • How To DIY Site Search Analytics Using Athena – Part 2

    How To DIY Site Search Analytics Using Athena – Part 2

    This article continues the work on our analytics application from Part 1. You will need to read Part 1 to understand the content of this post. “How To DIY Site search analytics — Part 2” will add the following features to our application:

    How-To Site-Search Analytics follow these steps

    1. Upload CSV files containing our E-Commerce KPIs in a way easily readable by humans.
    2. Convert the CSV files into Apache Parquet format for optimal storage and query performance.
    3. Upload Parquet files to AWS S3, optimized for partitioned data in Athena.
    4. Make Athena aware of newly uploaded data.

    CSV upload to begin your DIY for Site Search Analytics

    First, create a new Spring-Service that manages all file operations. Open your favorite IDE where you previously imported the application in part 1 and create a new class called FileService in the package com.example.searchinsightsdemo.service and paste in the following code:

    				
    					@Service
    public class FileService {
        private final Path uploadLocation;
        public FileService(ApplicationProperties properties) {
            this.uploadLocation = Paths.get(properties.getStorageConfiguration().getUploadDir());
        }
        public Path store(MultipartFile file) {
            String filename = StringUtils.cleanPath(file.getOriginalFilename());
            try {
                if (file.isEmpty()) {
                    throw new StorageException("Failed to store empty file " + filename);
                }
                if (filename.contains("..")) {
                    // This is a security check, should practically not happen as
                    // cleanPath is handling that ...
                    throw new StorageException("Cannot store file with relative path outside current directory " + filename);
                }
                try (InputStream inputStream = file.getInputStream()) {
                    Path filePath = this.uploadLocation.resolve(filename);
                    Files.copy(inputStream, filePath, StandardCopyOption.REPLACE_EXISTING);
                    return filePath;
                }
            }
            catch (IOException e) {
                throw new StorageException("Failed to store file " + filename, e);
            }
        }
        public Resource loadAsResource(String filename) {
            try {
                Path file = load(filename);
                Resource resource = new UrlResource(file.toUri());
                if (resource.exists() || resource.isReadable()) {
                    return resource;
                }
                else {
                    throw new StorageFileNotFoundException("Could not read file: " + filename);
                }
            }
            catch (MalformedURLException e) {
                throw new StorageFileNotFoundException("Could not read file: " + filename, e);
            }
        }
        public Path load(String filename) {
            return uploadLocation.resolve(filename);
        }
        public Stream<Path> loadAll() {
            try {
                return Files.walk(this.uploadLocation, 1)
                        .filter(path -> !path.equals(this.uploadLocation))
                        .map(this.uploadLocation::relativize);
            }
            catch (IOException e) {
                throw new StorageException("Failed to read stored files", e);
            }
        }
        public void init() {
            try {
                Files.createDirectories(uploadLocation);
            }
            catch (IOException e) {
                throw new StorageException("Could not initialize storage", e);
            }
        }


    That’s quite a lot of code. Let’s summarize the purpose of each relevant method and how it helps To DIY Site Search Analytics:

    • store: Accepts a MultipartFile passed by a Spring Controller and stores the file content on disk. Always pay extra attention to security vulnerabilities when dealing with file uploads. In this example, we use Spring’s StringUtils.cleanPath to guard against relative paths, to prevent someone from navigating up our file system. In a real-world scenario, this would not be enough. You’ll want to add more checks for proper file extensions and the like.
    • loadAsResource: Returns the content of a previously uploaded file as a Spring Resource.
    • loadAll: Returns the names of all previously uploaded files.

    To not unnecessarily inflate the article, I will refrain from detailing either the configuration of the upload directory or the custom exceptions. As a result, please review the packages com.example.searchinsightsdemo.config, com.example.searchinsightsdemo.service and the small change necessary in the class SearchInsightsDemoApplication to ensure proper setup.

    Now, let’s have a look at the Spring Controller. Using the newly created service, create a Class FileController in the package com.example.searchinsightsdemo.rest and paste in the following code:

    				
    					@RestController
    @RequestMapping("/csv")
    public class FileController {
        private final FileService fileService;
        public FileController(FileService fileService) {
            this.fileService = fileService;
        }
        @PostMapping("/upload")
        public ResponseEntity<String> upload(@RequestParam("file") MultipartFile file) throws Exception {
            Path path = fileService.store(file);
            return ResponseEntity.ok(MvcUriComponentsBuilder.fromMethodName(FileController.class, "serveFile", path.getFileName().toString()).build().toString());
        }
        @GetMapping("/uploads")
        public ResponseEntity<List<String>> listUploadedFiles() throws IOException {
            return ResponseEntity
                    .ok(fileService.loadAll()
                            .map(path -> MvcUriComponentsBuilder.fromMethodName(FileController.class, "serveFile", path.getFileName().toString()).build().toString())
                            .collect(Collectors.toList()));
        }
        @GetMapping("/uploads/{filename:.+}")
        @ResponseBody
        public ResponseEntity<Resource> serveFile(@PathVariable String filename) {
            Resource file = fileService.loadAsResource(filename);
            return ResponseEntity.ok()
                    .header(HttpHeaders.CONTENT_DISPOSITION, "attachment; filename="" + file.getFilename() + """).body(file);
        }
        @ExceptionHandler(StorageFileNotFoundException.class)
        public ResponseEntity<?> handleStorageFileNotFound(StorageFileNotFoundException exc) {
            return ResponseEntity.notFound().build();
        }
    }


    Nothing special. We just provided request mappings to;

    1. Upload a file
    2. List all uploaded files
    3. Serve the content of a file

    This will ensure the appropriate use of the service methods. Time to test the new functionality, start the Spring Boot application and run the following commands against it:

    				
    					# Upload a file:
    curl -s http://localhost:8080/csv/upload -F file=@/path_to_sample_application/sample_data.csv
    # List all uploaded files
    curl -s http://localhost:8080/csv/uploads
    # Serve the content of a file
    curl -s http://localhost:8080/csv/uploads/sample_data.csv


    The sampledata.csv file can be found within the project directory. However, you can also use any other file.

    Convert uploaded CSV files into Apache Parquet

    We will add another endpoint to our application which expects the name of a previously uploaded file that should be converted to Parquet. Please note that AWS also offers services to accomplish this; however, I want to show you how to DIY.

    Go to the FileController and add the following method:

    				
    					@PatchMapping("/convert/{filename:.+}")
        @ResponseBody
        public ResponseEntity<String> csvToParquet(@PathVariable String filename) {
            Path path = fileService.csvToParquet(filename);
            return ResponseEntity.ok(MvcUriComponentsBuilder.fromMethodName(FileController.class, "serveFile", path.getFileName().toString()).build().toString());
        }


    As you might have already spotted, the code refers to a method that does not exist on the FileService. Before adding that logic though, we first need to add some new dependencies to our pom.xml which enable us to create Parquet files and read CSV files:

    				
    					<dependency>
            <groupId>org.apache.parquet</groupId>
            <artifactId>parquet-hadoop</artifactId>
            <version>1.12.0</version>
        </dependency>
        <dependency>
            <groupId>org.apache.hadoop</groupId>
            <artifactId>hadoop-common</artifactId>
            <version>3.3.0</version>
        </dependency>
        <dependency>
            <groupId>org.apache.hadoop</groupId>
            <artifactId>hadoop-core</artifactId>
            <version>1.2.1</version>
        </dependency>
        <dependency>
            <groupId>org.apache.commons</groupId>
            <artifactId>commons-csv</artifactId>
            <version>1.8</version>
        </dependency>


    After updating the maven dependencies, we are ready to implement the missing part(s) of the FileService:

    				
    					public Path csvToParquet(String filename) {
            Resource csvResource = loadAsResource(filename);
            String outputName = getFilenameWithDiffExt(csvResource, ".parquet");
            String rawSchema = getSchema(csvResource);
            Path outputParquetFile = uploadLocation.resolve(outputName);
            if (Files.exists(outputParquetFile)) {
                throw new StorageException("Output file " + outputName + " already exists");
            }
            org.apache.hadoop.fs.Path path = new org.apache.hadoop.fs.Path(outputParquetFile.toUri());
            MessageType schema = MessageTypeParser.parseMessageType(rawSchema);
            try (
                    CSVParser csvParser = CSVFormat.DEFAULT
                            .withFirstRecordAsHeader()
                            .parse(new InputStreamReader(csvResource.getInputStream()));
                    CsvParquetWriter writer = new CsvParquetWriter(path, schema, false);
            ) {
                for (CSVRecord record : csvParser) {
                    List<String> values = new ArrayList<String>();
                    Iterator<String> iterator = record.iterator();
                    while (iterator.hasNext()) {
                        values.add(iterator.next());
                    }
                    writer.write(values);
                }
            }
            catch (IOException e) {
                throw new StorageFileNotFoundException("Could not read file: " + filename);
            }
            return outputParquetFile;
        }
        private String getFilenameWithDiffExt(Resource csvResource, String ext) {
            String outputName = csvResource.getFilename()
                    .substring(0, csvResource.getFilename().length() - ".csv".length()) + ext;
            return outputName;
        }
        private String getSchema(Resource csvResource) {
            try {
                String fileName = getFilenameWithDiffExt(csvResource, ".schema");
                File csvFile = csvResource.getFile();
                File schemaFile = new File(csvFile.getParentFile(), fileName);
                return Files.readString(schemaFile.toPath());
            }
            catch (IOException e) {
                throw new StorageFileNotFoundException("Schema file does not exist for the given csv file, did you forget to upload it?", e);
            }
        }


    That’s again quite a lot of code, and we want to relate it back to How best To DIY Site Search Analytics. So let’s try to understand what’s going on. First, we load the previously uploaded CSV file Resource that we want to convert into Parquet. From the resource name, we derive the name of an Apache Parquet schema file that describes the data types of each column of the CSV file. This results from Parquet’s binary file structure, which allows encoded data types. Based on the definition we provide in the schema file, the code will format the data accordingly before writing it to the Parquet file. More information can be found in the official documentation.

    The schema file of the sample data can be found in the projects root directory:

    				
    					message m { 
        required binary query; 
        required INT64 searches; 
        required INT64 clicks; 
        required INT64 transactions; 
    }


    It contains only two data types:

    1. binary: Used to store the query — maps to String
    2. INT64: Used to store the KPIs of the query — maps to Integer

    The content of the schema file is read into a String from which we can create a MessageType object that our custom CsvParquetWriter, which we will create shortly, needs to write the actual file. The rest of the code is standard CSV parsing using Apache Commons CSV, followed by passing the values of each record to our Parquet writer.

    It’s time to add the last missing pieces before we can create our first Parquet file. Create a new class CsvParquetWriter in the package com.example.searchinsightsdemo.parquet and paste in the following code:

    				
    					...
    import org.apache.hadoop.fs.Path;
    import org.apache.parquet.hadoop.ParquetWriter;
    import org.apache.parquet.hadoop.metadata.CompressionCodecName;
    import org.apache.parquet.schema.MessageType;
    public class CsvParquetWriter extends ParquetWriter<List<String>> {
        public CsvParquetWriter(Path file, MessageType schema) throws IOException {
            this(file, schema, DEFAULT_IS_DICTIONARY_ENABLED);
        }
        public CsvParquetWriter(Path file, MessageType schema, boolean enableDictionary) throws IOException {
            this(file, schema, CompressionCodecName.SNAPPY, enableDictionary);
        }
        public CsvParquetWriter(Path file, MessageType schema, CompressionCodecName codecName, boolean enableDictionary) throws IOException {
            super(file, new CsvWriteSupport(schema), codecName, DEFAULT_BLOCK_SIZE, DEFAULT_PAGE_SIZE, enableDictionary, DEFAULT_IS_VALIDATING_ENABLED);
        }
    }


    Our custom writer extends the ParquetWriter class, which we pulled in with the new maven dependencies. I added some imports to the snippet to visualize it. The custom writer does not need to do much; just call some super constructor classes with mostly default values, except that we use the SNAPPY codec to compress our files for optimal storage and cost reduction on AWS. What’s noticeable, however, is the CsvWriteSupport class that we also need to create ourselves. Create a class CsvWriteSupport in the package com.example.searchinsightsdemo.parquet with the following content:

    				
    					...
    import org.apache.hadoop.conf.Configuration;
    import org.apache.parquet.column.ColumnDescriptor;
    import org.apache.parquet.hadoop.api.WriteSupport;
    import org.apache.parquet.io.ParquetEncodingException;
    import org.apache.parquet.io.api.Binary;
    import org.apache.parquet.io.api.RecordConsumer;
    import org.apache.parquet.schema.MessageType;
    public class CsvWriteSupport extends WriteSupport<List<String>> {
        MessageType             schema;
        RecordConsumer          recordConsumer;
        List<ColumnDescriptor>  cols;
        // TODO: support specifying encodings and compression
        public CsvWriteSupport(MessageType schema) {
            this.schema = schema;
            this.cols = schema.getColumns();
        }
        @Override
        public WriteContext init(Configuration config) {
            return new WriteContext(schema, new HashMap<String, String>());
        }
        @Override
        public void prepareForWrite(RecordConsumer r) {
            recordConsumer = r;
        }
        @Override
        public void write(List<String> values) {
            if (values.size() != cols.size()) {
                throw new ParquetEncodingException("Invalid input data. Expecting " +
                        cols.size() + " columns. Input had " + values.size() + " columns (" + cols + ") : " + values);
            }
            recordConsumer.startMessage();
            for (int i = 0; i < cols.size(); ++i) {
                String val = values.get(i);
                if (val.length() > 0) {
                    recordConsumer.startField(cols.get(i).getPath()[0], i);
                    switch (cols.get(i).getType()) {
                        case INT64:
                            recordConsumer.addInteger(Integer.parseInt(val));
                            break;
                        case BINARY:
                            recordConsumer.addBinary(stringToBinary(val));
                            break;
                        default:
                            throw new ParquetEncodingException(
                                    "Unsupported column type: " + cols.get(i).getType());
                    }
                    recordConsumer.endField(cols.get(i).getPath()[0], i);
                }
            }
            recordConsumer.endMessage();
        }
        private Binary stringToBinary(Object value) {
            return Binary.fromString(value.toString());
        }
    }


    Here we extend WriteSupport where we need to override some more methods. The interesting part is the write method, where we need to convert the String values, read from our CSV parser, into the proper data types defined in our schema file. Please note that you may need to extend the switch statement should you require more data types than in the example schema file.

    Turning on the Box

    Testing time, start the application and run the following commands:

    				
    					# Upload the schema file of the example data
    curl -s http://localhost:8080/csv/upload -F file=@/path_to_sample_application/sample_data.schema
    # Convert the CSV file to Parquet
    curl -s -XPATCH http://localhost:8080/csv/convert/sample_data.csv


    If everything worked correctly, you should find the converted file in the upload directory:

    				
    					[user@user search-insights-demo (⎈ |QA:ui)]$ ll /tmp/upload/
    insgesamt 16K
    drwxr-xr-x  2 user  user   120  4. Mai 10:34 .
    drwxrwxrwt 58 root  root  1,8K  4. Mai 10:34 ..
    -rw-r--r--  1 user  user   114  3. Mai 15:44 sample_data.csv
    -rw-r--r--  1 user  user   902  4. Mai 10:34 sample_data.parquet
    -rw-r--r--  1 user  user    16  4. Mai 10:34 .sample_data.parquet.crc
    -rw-r--r--  1 user  user   134  4. Mai 10:31 sample_data.schema


    You might be wondering why the .parquet file size is greater than the .csv file. As I said, we are optimizing the storage size as well. The answer is pretty simple. Our CSV file contains very little data, and since Parquet stores the data types and additional metadata in the binary file, we don’t gain the benefit of compression. However, your CSV file will have more data, so things will look different. The raw CSV data of a single day from a real-world scenario is 11.9 MB whereas the converted Parquet file only weights 1.4 MB! That’s a reduction of 88% which is pretty impressive.

    Upload the Parquet files to S3

    Now that we have the parquet files locally, it’s time to upload them to AWS S3. We already created our Athena database, in part one, where we enabled partitioning by a key called dt:

    				
    					...
    PARTITIONED BY (dt string)
    STORED AS PARQUET
    LOCATION 's3://search-insights-demo/'


    this means we need to upload the files into the following bucket structure:

    				
    					├── search-insights-demo
    │   └── dt=2021-05-04/
    │       └── analytics.parquet


    Each parquet file needs to be placed in a bucket with the prefix dt= followed by the date relative to the corresponding KPIs. The name of the parquet file does not matter as long as its extension is .parquet.

    It’s Hack Time

    So let’s start coding. Add the following method to the FileController:

    				
    					@PatchMapping("/s3/{filename:.+}")
        @ResponseBody
        public URL uploadToS3(@PathVariable String filename) {
            return fileService.uploadToS3(filename);
        }


    and to the FileService respectively:

    				
    					public URL uploadToS3(String filename) {
            Resource parquetFile = loadAsResource(filename);
            if (!parquetFile.getFilename().endsWith(".parquet")) {
                throw new StorageException("You must upload parquet files to S3!");
            }
            try {
                AmazonS3 s3 = AmazonS3ClientBuilder.standard().build();
                File file = parquetFile.getFile();
                long lastModified = file.lastModified();
                LocalDate partitionDate = Instant.ofEpochMilli(lastModified)
                        .atZone(ZoneId.systemDefault())
                        .toLocalDate();
                String bucket = String.format("search-insights-demo/dt=%s", partitionDate.toString());
                s3.putObject(bucket, "analytics.parquet", file);
                return s3.getUrl(bucket, "analytics.parquet");
            }
            catch (SdkClientException | IOException e) {
                throw new StorageException("Failed to upload file to s3", e);
            }
        }


    The code won’t compile before adding another dependency to our pom.xml:

    				
    					<dependency>
        <groupId>com.amazonaws</groupId>
        <artifactId>aws-java-sdk-s3</artifactId>
        <version>1.11.1009</version>
    </dependency>


    Please don’t forget that you need to change the base bucket search-insights-demo to the one you used when creating the database!

    Testing time:

    				
    					# Upload the parquet file to S3
    curl -s -XPATCH http://localhost:8080/csv/s3/sample_data.parquet


    The result should be the S3 URL where you can find the uploaded file.

    Make Athena aware of newly uploaded data

    AWS Athena does not constantly scan your base bucket for newly uploaded files. So if you’re attempting to DIY Site Search Analytics, you’ll need to execute an SQL statement that triggers the rebuild of the partitions. Let’s go ahead and add the necessary small changes to the FileService:

    				
    					...
    private static final String QUERY_REPAIR_TABLE = "MSCK REPAIR TABLE " + ANALYTICS.getName();
        private final Path          uploadLocation;
        private final DSLContext    context;
        public FileService(ApplicationProperties properties, DSLContext context) {
            this.uploadLocation = Paths.get(properties.getStorageConfiguration().getUploadDir());
            this.context = context;
        }
    ...
    				
    			
    1. First, we add a constant repair table SQL snippet that uses the table name provided by JOOQ’s code generation.
    2. Secondly, we autowire the DSLContext provided by Spring into our service.
    3. For the final step, we need to add the following lines to the public URL uploadToS3(String filename) method, right before the return statement:
    				
    					...
    context.execute(QUERY_REPAIR_TABLE);


    That’s it! With these changes in place, we can test the final version of part 2

    				
    					curl -s -XPATCH http://localhost:8080/csv/s3/sample_data.parquet
    # This time, not only was the file uploaded, but the content should also be visible for our queries. So let's get the count of our database
    curl -s localhost:8080/insights/coun`


    The response should match our expected value 3 — which matches the number of rows in our CSV file — and you should be able to see the following log message in your console:

    				
    					Executing query          : select count(*) from "ANALYTICS"
    Fetched result           : +-----+
                             : |count|
                             : +-----+
                             : |    3|
                             : +-----+                                                                  
    Fetched row(s)           : 1   


    Summary

    In part two of this series, we showed how to save storage costs and gain query performance by creating Apache Parquet files from plain old CSV files. Those files play nicely with AWS Athena, especially when you further partition them by date. E-Commerce KPIs can be partitioned precisely by a single day. After all, the most exciting queries span a range, e.g., show me the top queries of the last X days, weeks, months. This is the exact functionality we will add in the next part, where we extend our AthenaQueryServiceby some meaningful queries. Stay tuned and join us soon for part three of this series, coming soon!

    By the way: The source code for part two can be found on GitHub.

  • How-To Solr E-Commerce Search

    How-To Solr E-Commerce Search

    Solr Ecommerce Search –

    A Best Practice Guide — Part 1

    How-To Do Solr E-Commerce Search just right? Well, imagine you want to drive to the mountains for a holiday. You take along your husband or wife and your two children (does it get any more stereotypical?) — what kind of car would you take? The two-seater sports car or the station wagon? Easy choice, you say? Well, choosing Solr as your e-commerce search engine is a bit like taking the sports car on the family tour.

    Part of the issue is how Solr was originally conceived. Initially, Solr was designed to perform as a full-text search engine for content, not products. Although it has evolved “a little” since then, there are still a few pitfalls that you should avoid.

    That said, I’d like to show you some best practices and tips from one of my projects. In the end, I think Solr is good at getting the job done after all. 😉

    How to Not Reinvent the Wheel When Optimizing Solr for E-commerce Search

    First, don’t reinvent the wheel when integrating basic things like synonyms and boostings on the Lucene level. These can be more easily managed using open-source add-ons like Querqy.

    If you want to perform basic tasks such as eliminating specific keywords from consideration, replacing words with alternatives better matching your product data, or simply setting up synonyms and boostings… Querqy does the job with a minimal of effort.Solr, by default, uses a scoring model called TF/IDF (Term Frequency/Inverse Document Frequency). In short, it scores documents higher with more occurrences of a search term. And lower if fewer documents contain the search term.

    For general use cases, how often a search term resides in a text document may be important; for e-commerce search, however, this is most often not the case.

    E-Commerce does not concern itself with search term frequency but rather with where, in which field, the search term is found.

    How-To Teach Solr to Think Like an E-Commerce Search Manager

    To help Solr account for this, simply set the “tie” option for your request handler to 0.0. This will have the positive effect of only considering the best matching field. It will not sum up all fields, which could adversely result in a scenario where the sum of the lower weighted fields is greater than your best matching most important field.

    How-To Fix Solr’s Similarity Issues for E-Commerce Search

    Secondly, turn off the similarity scoring by setting uq.similarityScore to “off.”

    				
    					<float name="tie">0.0</float> <str name="uq.similarityScore">off</str>


    This will ensure a more usable scoring for e-commerce scenarios. Moreover, by eliminating similarity scoring, result sorting is more customer-centric and understandable. This more logical sorting results from product name field matches leading to higher scores than matches found in the description texts. Don’t forget to set up your field boostings correctly as well!

    Give my previous blog post about search relevancy a read for more advice on what to consider for good scores.

    Even with the best scoring and result sorting, the number of items returned can be overwhelming for the user. Especially for generic queries like “smartphone,” “washing machine,” or “tv.”

    How-To Do Facets Correctly in Solr

    The logical answer to this problem is, of course — faceting.

    Enabling your visitors to drill down to their desired products is critical.

    While it may be simple to know upfront which facets are relevant to a particular category within a relatively homogenous result-set, the more heterogeneous search results become, the greater the challenge. And, of course, you don’t want to waste CPU power and time for facets that are irrelevant to your current result set, especially if you have hundreds or even thousands of them.

    So, wouldn’t it be nice to know which fields Solr should use as facets — before calling it? After all, it’s not THAT easy. You need to take a two-step approach.

    For this to work, you have to store all relevant facet field names for a single product in a special field. Let’s call it, e.g., “facet_fields.” It will contain an array of field names, e.g.

    Facets For Product 1 (tablet):

    				
    					"category", "brand", "price", "rating", "display_size", "weight""category", "brand", "price", "rating", "display_size", "weight"


    Facets For Product 2 (freezer):

    				
    					"category", "brand", "price", "width", "height", "length", "cooling_volume”


    Facets For Product 3 (tv):

    				
    					"category", "brand", "price", "display_size", "display_technology", "vesa_wall_mount"


    If a specific type, e.g., “televisions,” is searched, you can now make an initial call to Solr with just ONE facet, based on the “facet_fields” field, which will return available facets restricted to the found televisions.

    Additionally, it’s possible to significantly reduce overhead by holding off requesting untimely product data at this stage.

    It may also be the right time to run a check confirming whether you get back any matches at all or if you ended up on the zero result page.

    If that is the case, you can either try the “spellcheck” component of Solr to fix typos in your query or implement our SmartQuery technology to avoid these situations in most cases right from the start.

    Now, you use the information collected in the first call to request facets based on “category”, “brand”, “price”, “display_size”, “display_technology” and “vesa_wall_mount”, in the second call to Solr.

    How-To Reduce Load with Intelligent Facet-Rules !

    You might argue that some of these facets are so general in nature that there isn’t a need to store and request them each time—things like category, brand, and price. And you would be right. So if you want to save memory, use a whitelist for the generic facets and combine them with the special facets from your initial request.

    Let’s have a look at an example. Imagine someone searches for “Samsung.” This will return a very mixed set of results with products across all 3 areas of the above facets example. Nevertheless, you can use the information from the first call to Solr to filter out facets that do not apply to a significant sample of the result.

    A note of caution: the additional effort of filtering out facets with low coverage may prove more useful, at a later stage, once additionally applied filters — on the category, for example — reveal a particular relevance for a given facet, which was not evident initially. Once the user decides to go for “Smartwatches” following a search for “Samsung,” the “wrist size” suddenly gains importance. This makes clear why we only drop facets that are not present in our result set at all.

    Now that the result has facets, it might make sense to offer the user a multi-select option for the values. This allows them to choose, side by side, whether the TV is from LG, Samsung, or Sony.

    How-To Exclude Erroneous Facet Results

    The good news is that Solr has a built-in option to ignore set filters for generating a specific facet.

    				
    					facet.field={!ex=brand}brand fq={!tag=brand}brand:("SAMSUNG" OR "LG" OR "SONY")


    This is how we tag the facet field to exclude it during filtering. Then using the filter query, we have to pass that tag again, so Solr knows what to exclude.

    You can also use other tags. Just be sure to keep track of which tag you use for which facet! So, something like this also works (using “br” instead of the full field name “brand” — this is useful, if you have more structured

    field names like “facet_fields.brand”):

    				
    					facet.field={!ex=br}facet_fields.brand fq={!tag=br}facet_fields.brand:("SAMSUNG" OR "LG" OR "SONY")


    Define Constraints for Numeric Fields for Slider-Facets

    But what about numeric fields like price or measurements like width, height, etc.?

    Using these fields to gather the required data to create a slider facet is fairly easy.

    Just enable the stats component and name which details you require:

    				
    					stats=true stats.field={!ex=price min=true max=true count=true}pric


    The response includes the minimum and maximum values respective to your result. These form the absolute borders of your slider.

    Additionally, use the count to also filter out irrelevant facets by a coverage factor.

    				
    					stats": {
        "stats_fields": {
            "price": {
                "min": 89.0,
                "max": 619.0,
                "count": 188
            }
        }
    }


    Remember, if you filter on price, to set the slider’s lower and upper touch-points to correspond to the actual filter values!

    Otherwise, your customers have to repeatedly select it 😉

    So from the stats response, you have the absolute minimum and maximum. And you’ve set the minimum and maximum of the filter.

    Solr E-Commerce Search – Not Bad After All

    Congratulations! You now know how to tune your Solr basic scoring algorithm to perform best in e-commerce scenarios. Not only that, you know how to make the best use of your facets within Solr.

    In the next episode of this best practices guide, I would like to dive deeper into how to correctly weight and boost your products. At the same time, I want to pull back the curtain on how to master larger multi-channel environments without going to Copy/Paste hell. So stay tuned!

  • Simple, Simpler, Perfect – Finding Complexity in Simplicity

    Simple, Simpler, Perfect – Finding Complexity in Simplicity

    How to frame simple, simpler, perfect? A drum teacher once told me – “To play a simple beat really well, you must first master the complex stuff; practice a lot. Then revisit the simple beat”. At the time, I was not particularly convinced. I mean, how hard could an AC/DC drum pattern be? Actually, really simple. But the drum teacher was wise, and I guarantee you, even with an untrained ear, in a blind test, you’ll vote for AC/DC’s drummer above my playing any day of the week and twice on Sunday. Because simple things like how you attack the note, the timing precision of each stroke, sum up to playing a simple beat perfectly vs. “kind of ok.”

    How the K.I.S.S. Concept Applies to Software Development

    This concept applies to software as well. Like music, you compose software, combining different components and functionality, then interface into something a client can understand. As in music, you can’t expect easy adoption if you’re composing avant-garde techno-folk-jazz music.

    Simple

    Previously I wrote about dumb services architecture, but the application of the “simplicity concept” is tied most strongly to the client experience. If your core client experience is simple to understand, you’ll appeal to a much wider audience.

    To restate: your product improves, congruent to your focus on polishing the simple things in your software. Perhaps even simpler (pun intended). Simplicity = Scale.

    Simpler

    Scaling your software and business is more manageable when you focus on the core client experience. In the case of software, though, unlike music, the effects of this concept are multiplied.

    • Users will intuitively pick your polished product over the competition.
    • No need to educate users on how to use the software
    • Users can show and persuade others to use your software. With a strong core experience, users can build a mental model of your product, creating natural advocates for you.
    • Your software is easier to maintain and deploy. Now, this may not always be true, especially if you leverage a simple user experience to hide a lot of complexity. Nevertheless, at least at the UI level, it still has merit.

    Perfect

    Last week an event occurred that offers the perfect example for the above. Coinbase IPOed at $100b valuation. Now, you may or may not follow cryptocurrencies, but here’s the essence of the story. They beat all the competition within the crypto-industry by creating a simple, polished, core client experience. Everything else was secondary for them.

    Simply Complex Perfection

    In conclusion: before building, ask yourself a few questions. Is this client functionality necessary? Even if they insist, will it bring value to your core experience? Are 3 layers of backend frameworks essential to make an SQL query? These decisions are hard to make. Paradoxically, building simply is more arduous than building complexly. But it pays off.

  • How-To Setup Elasticsearch Benchmarking with Rally

    How-To Setup Elasticsearch Benchmarking with Rally

    How to set up Elasticsearch benchmarking, using Elastic’s own tools, is a necessity in today’s eCommerce. In my previous articles, I describe how to operate Elasticsearch in Kubernetes and how to monitor Elasticsearch. It’s time now to look at how Elastic’s homegrown benchmarking tool, Rally, will increase your performance, while saving you unnecessary cost, and headaches.

    This article is part one of a series. This first part provides you with:

    • a short overview of Rally
    • a short sample track

    Why to Benchmark in Elasticsearch with Rally?

    Surely, you’re thinking, why should I benchmark Elasticsearch, isn’t there a guide illustrating the best cluster specs for Elasticsearch, eliminating all my problems?

    The answer: a resounding “no”. There is no guide to tell you how the “perfect” cluster should look.

    After all, the “perfect” cluster highly depends on your data structure, your amount of data, and your operations against Elasticsearch. As a result, you will need to perform benchmarks relevant to your unique data and processes to find bottlenecks and tune your Elasticsearch cluster.

    What does Elastic’s Benchmarking Tool Rally Do?

    Rally is the macro-benchmarking framework for Elasticsearch from elastic itself. Developed for Unix, Rally runs best on Linux and macOS but also supports Elasticsearch clusters running Windows. Rally can help you with the following tasks:

    • Setup and teardown of an Elasticsearch cluster for benchmarking
    • Management of benchmark data and specifications even across Elasticsearch versions
    • Running benchmarks and recording results
    • Finding performance problems by attaching so-called telemetry devices
    • Comparing performance results and export them (e.g., to Elasticsearch itself)


    Because we are talking about benchmarking a cluster, Rally also needs to fit the requirements to benchmark clusters. For this reason, Rally has special mechanisms based on the Actor-Model to coordinate multiple Rally instances, like a “cluster” to benchmark a cluster.

    Basics about Rally Benchmarking

    Configure Rally using the rally.ini file. Take a look here to get an overview of the configuration options.

    Within Rally, benchmarks are defined in tracks. A track contains one or multiple challenges and all data needed for performing the benchmark.

    Data is organized in indices and corporas. The indices include the index name and index settings against which the benchmark must perform. Additionally, the indices include the corpora, which contains the data to be indexed.

    And, sticking with the “Rally” theme, if we run a benchmark, we call it a race.

    Every challenge has one or multiple operations applied in a sequence or parallel to the Elasticsearch.

    An operation, for example, could be a simple search or a create-index. It’s also possible to write simple or more complex operations called custom runners. However, there are pre-defined operations for the most common tasks. My illustration below will give you a simple overview of the architecture of a track:

    Note: the above image supplies a sample of the elements within a track to explain how the internal process looks.

    Simple sample track

    Below, an example of a track.json and an index-with-one-document.json for the index used in the corpora:

    				
    					{
      "version": 2,
      "description": "Really simple track",
      "indices": [
        {
          "name": "index-with-one-document"
        }
      ],
      "corpora": [
        {
          "name": "index-with-one-document",
          "documents": [
            {
              "target-index": "index-with-one-document",
              "source-file": "index-with-one-document.json",
              "document-count": 1
            }
          ]
        }
      ],
      "challenges": [
        {
          "name": "index-than-search",
          "description": "first index one document, then search for it.",
          "schedule": [
            {
              "operation": {
                "name": "clean elasticsearch",
                "operation-type": "delete-index"
              }
            },
            {
              "name": "create index index-with-one-document",
              "operation": {
                "operation-type": "create-index",
                "index": "index-with-one-document"
              }
            },
            {
              "name": "bulk index documents into index-with-one-document",
              "operation": {
                "operation-type": "bulk",
                "corpora": "index-with-one-document",
                "indices": [
                  "index-with-one-document"
                ],
                "bulk-size": 1,
                "clients": 1
              }
            },
            {
              "operation": {
                "name": "perform simple search",
                "operation-type": "search",
                "index": "index-with-one-document"
              }
            }
          ]
        }
      ]
    }


    index-with-one-document.json:

    				
    					{ "name": "Simple test document." }


    The track above contains one challenge, one index, and one corpora. The corpora refers to the index-with-one-document.json, which includes one document for the index. The challenge has four operations:

    delete-index → delete the index from Elasticsearch so that we have a clean environment create-index → create the index we may have deleted before Bulk → bulk index our sample document from index-with-one-document.json. Search → perform a single search against our index

    Taking Rally for a Spin

    Let’s race this simple track and see what we get:

    				
    					(⎈ |qa:/tmp/blog)➜  test_track$ esrally --distribution-version=7.9.2 --track-path=/tmp/blog/test_track     
        ____        ____
       / __ ____ _/ / /_  __
      / /_/ / __ `/ / / / / /
     / _, _/ /_/ / / / /_/ /
    /_/ |_|__,_/_/_/__, /
                    /____/
    [INFO] Preparing for race ...
    [INFO] Preparing file offset table for [/tmp/blog/test_track/index-with-one-document.json] ... [OK]
    [INFO] Racing on track [test_track], challenge [index and search] and car ['defaults'] with version [7.9.2].
    Running clean elasticsearch                                                    [100% done]
    Running create index index-with-one-document                                   [100% done]
    Running bulk index documents into index-with-one-document                      [100% done]
    Running perform simple search                                                  [100% done]
    ------------------------------------------------------
        _______             __   _____
       / ____(_)___  ____ _/ /  / ___/_________  ________
      / /_  / / __ / __ `/ /   __ / ___/ __ / ___/ _ 
     / __/ / / / / / /_/ / /   ___/ / /__/ /_/ / /  /  __/
    /_/   /_/_/ /_/__,_/_/   /____/___/____/_/   ___/
    ------------------------------------------------------
    |                                                         Metric |                                              Task |       Value |   Unit |
    |---------------------------------------------------------------:|--------------------------------------------------:|------------:|-------:|
    |                     Cumulative indexing time of primary shards |                                                   | 8.33333e-05 |    min |
    |             Min cumulative indexing time across primary shards |                                                   | 8.33333e-05 |    min |
    |          Median cumulative indexing time across primary shards |                                                   | 8.33333e-05 |    min |
    |             Max cumulative indexing time across primary shards |                                                   | 8.33333e-05 |    min |
    |            Cumulative indexing throttle time of primary shards |                                                   |           0 |    min |
    |    Min cumulative indexing throttle time across primary shards |                                                   |           0 |    min |
    | Median cumulative indexing throttle time across primary shards |                                                   |           0 |    min |
    |    Max cumulative indexing throttle time across primary shards |                                                   |           0 |    min |
    |                        Cumulative merge time of primary shards |                                                   |           0 |    min |
    |                       Cumulative merge count of primary shards |                                                   |           0 |        |
    |                Min cumulative merge time across primary shards |                                                   |           0 |    min |
    |             Median cumulative merge time across primary shards |                                                   |           0 |    min |
    |                Max cumulative merge time across primary shards |                                                   |           0 |    min |
    |               Cumulative merge throttle time of primary shards |                                                   |           0 |    min |
    |       Min cumulative merge throttle time across primary shards |                                                   |           0 |    min |
    |    Median cumulative merge throttle time across primary shards |                                                   |           0 |    min |
    |       Max cumulative merge throttle time across primary shards |                                                   |           0 |    min |
    |                      Cumulative refresh time of primary shards |                                                   | 0.000533333 |    min |
    |                     Cumulative refresh count of primary shards |                                                   |           3 |        |
    |              Min cumulative refresh time across primary shards |                                                   | 0.000533333 |    min |
    |           Median cumulative refresh time across primary shards |                                                   | 0.000533333 |    min |
    |              Max cumulative refresh time across primary shards |                                                   | 0.000533333 |    min |
    |                        Cumulative flush time of primary shards |                                                   |           0 |    min |
    |                       Cumulative flush count of primary shards |                                                   |           0 |        |
    |                Min cumulative flush time across primary shards |                                                   |           0 |    min |
    |             Median cumulative flush time across primary shards |                                                   |           0 |    min |
    |                Max cumulative flush time across primary shards |                                                   |           0 |    min |
    |                                             Total Young Gen GC |                                                   |       0.022 |      s |
    |                                               Total Old Gen GC |                                                   |       0.033 |      s |
    |                                                     Store size |                                                   | 3.46638e-06 |     GB |
    |                                                  Translog size |                                                   | 1.49012e-07 |     GB |
    |                                         Heap used for segments |                                                   |  0.00134659 |     MB |
    |                                       Heap used for doc values |                                                   | 7.24792e-05 |     MB |
    |                                            Heap used for terms |                                                   | 0.000747681 |     MB |
    |                                            Heap used for norms |                                                   | 6.10352e-05 |     MB |
    |                                           Heap used for points |                                                   |           0 |     MB |
    |                                    Heap used for stored fields |                                                   | 0.000465393 |     MB |
    |                                                  Segment count |                                                   |           1 |        |
    |                                                 Min Throughput | bulk index documents into index-with-one-document |         7.8 | docs/s |
    |                                              Median Throughput | bulk index documents into index-with-one-document |         7.8 | docs/s |
    |                                                 Max Throughput | bulk index documents into index-with-one-document |         7.8 | docs/s |
    |                                       100th percentile latency | bulk index documents into index-with-one-document |     123.023 |     ms |
    |                                  100th percentile service time | bulk index documents into index-with-one-document |     123.023 |     ms |
    |                                                     error rate | bulk index documents into index-with-one-document |           0 |      % |
    |                                                 Min Throughput |                             perform simple search |       16.09 |  ops/s |
    |                                              Median Throughput |                             perform simple search |       16.09 |  ops/s |
    |                                                 Max Throughput |                             perform simple search |       16.09 |  ops/s |
    |                                       100th percentile latency |                             perform simple search |     62.0082 |     ms |
    |                                  100th percentile service time |                             perform simple search |     62.0082 |     ms |
    |                                                     error rate |                             perform simple search |           0 |      % |
    --------------------------------
    [INFO] SUCCESS (took 39 seconds)
    --------------------------------


    Parameters we used:

    • distribution-version=7.9.2 → The version of Elasticsearch Rally should start/use for benchmarking.
    • track-path=/tmp/blog/test_track → The path to our track location.

    As you can see, Rally provides us a summary of the benchmark and information about each operation and how they performed.

    Rally Benchmarking in the Wild

    This part-one introduction to Rally Benchmarking hopefully piqued your interest for what’s to come. My next post will dive deeper into a more complex sample. I’ll use a real-world benchmarking scenario within OCSS (Open Commerce Search Stack) to illustrate how to export benchmark-metrics to Elasticsearch, which can then be used in Kibana for analysis.

    References

  • Search Quality in eCommerce Sellability – Three Pillars Series Part 3

    Search Quality in eCommerce Sellability – Three Pillars Series Part 3

    Previously, in this series we discussed why Findability, Discovery, and Inspiration are vital for analyzing and understanding search quality in eCommerce. These search quality dimensions relate mainly to the items or products themselves. We now turn our attention to another dimension, defined as Search Quality in eCommerce Sellability.

    What are the Three Pillars of Search Quality – a Recap

    Let me articulate this as clearly as possible: Relevance and Discovery or Inspiration, in isolation, are insufficient to judge search quality for eCommerce. And this is why.

    Even if still in the consideration phase, shoppers are often not simply looking for a product. And as a seller, you are not just offering products. The offer you make as a seller to a potential buyer is (almost) always a combination of a product and its more or less time-specific availability and price. Unfortunately, many people tend to forget or ignore this — most likely due to the added complexity. Still, it is indeed one of the most critical parts of the puzzle.

    If you fail to consider this, I guarantee you will forfeit the full potential your business could achieve. This is true irrespective of whether you are lucky or hardworking enough to have built or bought the best search & discovery platform out there. Provided you are not selling a unique product or type of product(s), alternative offers will exist. Based on the incredibly high adoption rate of Google, Bing, Amazon, Alibaba, et al., shoppers are aware of alternative offers.

    Side note: There is, even more, to consider (quality of service, branding, trust, you name it) which, potentially, all influence the buying decision and, more specifically, the price sensitivity of a prospective buyer. But these factors are either very hard to differentiate or quantify (measure) at scale, while product pricing and availability are not. That’s why, I’ll focus on the latter in this post.

    eCommerce Search Quality – Product Sellability

    Sellability is a compound of the words Sell and Probability. It describes the likelihood or probability that a specific product sells at a particular time if exposed to the shopper. For simplicity’s sake, let’s assume all product properties are static. A fair condition unless the product gets an upgrade or update. In this case, there are only three dimensions you the seller can influence: demand, availability, and price.

    Demand as a Dimension of Sellability

    Product demand can be generated or managed easily enough with marketing initiatives and seasonal or trend effects. This is admittedly no trivial task in and of itself. Naturally, if you are the first to sell an in demand product, you have the upper hand. You have first dibs on pulling some of this demand to your platform. And, your short-term monopoly typically means greater price elasticity.

    Availability as a Dimension of Sellability

    If a product is not in stock or unavailable, it’s pretty damn hard to sell. Therefore, regarding availability, there are also a couple of different scenarios to consider.

    1. You’re in the fortunate position to be the only one or one of the few who can sell a specific product. Maybe you have the exclusive right, or you are just faster in onboarding new products.
    2. The product is not yet in or out-of-stock.
    3. The product is generally available and in-stock.

    Price as a Dimension of Sellability

    Unfortunately, things get a bit more complicated when it comes to price. Demand-forecasting and price-optimization are two significant research areas of their own. However, using the following three scenarios, we can model the real world with reasonable accuracy. Please be aware: I assume the product is available. And as noted earlier, there are no distinct factors of competitive differentiation.

    1. Your offer has the lowest price compared with all alternative offers.
    2. Your offer has the highest price compared with all alternative offers.
    3. The price in your offer is quite close to your competition.

    Real-World Sellability Calculation

    Until now, we have reviewed the problem in theory only. Let’s switch gears and examine some actual data to check if we can spot any exciting patterns, correlations, or tendencies. These will help us better understand the problem we need to solve. We also hope to discover how sellability influences the results we measure and our Search Quality interpretation. Before we jump in, let me share how I gathered the data and why.

    Sellability Calculation Methodology

    First off, I spent some time researching products that at least three of our customers sell. After all it’s pretty useless attempt to understand sellability with data from just one shop. I looked at historical sales, prices, and availabilities over the last year.

    Unfortunately, I’m not permitted to share any information about the sellers, their products, or prices. However, I can show is non-brand-specific information.

    As a next step, I removed products for which we hadn’t enough data-points coverage over the last 12 months. And from the rest, I picked a small random sample-set for further analysis.

    Additionally, I put the resulting products into four different price buckets (under €10, between €10-50, and above €100). I then filtered out all products, within the designated period, with a significant price variation, that resulted in a bucket change. I manually sorted these into an altogether separate bucket ensuring they would not be part of the current evaluation.

    Sellability – How To Extract Useful Information from the Data

    This gave me eleven unique products in the first, ten in the second, and fifteen in the third bucket. All products fulfilled the above criteria. Once I had the data, I mainly observed the influence of pricing and availability on the view2click, view2buy-ratio, and nDCG@20.

    How To Leverage view2click and the view2buy-ratios

    For the pricing, I decided to do the following. I wanted to evaluate how a shop and its competitor’s pricing influences the respective shop metrics. So, I calculated the percent difference in price between the shop in question and the minimum price of its competition.

    The view2click-ratio is a straightforward yet compelling metric. It essentially gives you an idea of how attractive a product is for your audience. The closer this ratio gets to 1, the more attractive the product seems to be for your audience.

    The view2buys-ratio is quite similar. It’s more explicit in terms of business value since it essentially measures how well a product sells. Once again, the closer this ratio gets to 1, the more sellable the product seems to be for your audience.

    nDCG@20 and Your Search Quality Bias

    Regarding nDCG@20 — Many companies use implicit feedback (Clicks and Carts) as signals to develop query-relevance judgments in eCommerce. Based on these judgments, they then run automated nDCG-evaluations. Much effort can and should be spent on methods to understand these signals’ correct conclusions. I will keep it straightforward though, since the effects I’m looking for will affect each method or model below.

    1. For a given query, we count the clicks and carts for every product in the result-set.
    2. For clicks, we assign a weight of 1, and carts a weight of 3. Then calculate the weighted sum for each query/product pair and assign it to the variable interactions.
    3. Now we do a maximum-normalization. We take the maximum number of interactions for every query and divide all the other product interactions by this value. You can skip this normalization, or you could and should use other normalization functions. Let’s stick with this one for simplicity’s sake. In this way, all interaction values for our query/product tuples are normalized within a range between (0,1).
    4. The next thing we have to do is map the interaction values into the judgment space. There might exist infinite methods to do this, but I will again keep it straightforward. Let’s say we are going to assign judgments from (1,5). This results in 5 different judgment values that we could assign to a query/product pair. So let’s divide the interaction value range into five equal-sized buckets. For example, query/product pairs with an interaction value below 0.2 would map to judgment value 1, and so on.
    5. Once we have this mapping in place, we can calculate an optimal product ranking based on the judgments.
    6. Now we compare our optimal product ranking based on judgments with the observed click positions on the first 20 results and thus arrive at the nDCG@20.

    nDCG@20 a Practical View

    Suppose you work for a company that gathers implicit feedback (Clicks and Carts). It uses this feedback as signals to develop query-relevance judgments for eCommerce. They then perform automated NDCG-evaluations based on these judgments. If this sound like you, have a closer look at the next part.

    With everything defined, I went on and calculated the different values for which I was looking. I did this for all three shop-competitor combinations and averaged the results, printing them in the following chart.

    View2Buy ratio vs. price difference to competition for products in the price range under €10

    The above chart illustrates the significant impact of price and availability on the number of clicks and carts for your search results. This results in quite a lot of bias in your search-quality measurement (or Learning-to-Rank) pipeline.

    The issue here is that changes in price or availability can significantly influence the user’s contextual relevance. This is true even if the textual and or semantic relevance between query and product hasn’t changed at all. This directly affects the click and cart probabilities.

    You may have spotted that I only include the data for the first price bucket. If you are interested in how the charts look like for the other buckets, PM me 🙂

    Conclusion

    This is the final entry for the Three Pillars of Search Quality in eCommerce Search series. I hope that the content I created helps you during your journey. To discover the perfect balance between what the seller wants to sell and what the users want to buy.

    Furthermore, if you’ve made it this far, you’re without excuse if you’re ever found stuck in strategies that never venture beyond findability improvements. You’re now equipped with the knowledge necessary to begin balancing the optimization of your discovery and inspiration journeys, against the underlying dimension of sellability.

    Final words: It’s no trivial task to fix these types of bias. I understand that. However, over-simplifying the problem and ignoring the facts won’t help you differentiate from the competition. There is no way around it. Offering an outstanding shopping discovery experience means taking external factors (like market trends, or competitor pricing) into account.

    Good Luck!